

TL;DR
- Using historical data from two independent and survivorship-free databases, we study returns to buying new tokens, relative to Bitcoin.
- The market for new tokens looks surprisingly efficient, in that returns are neither systematic nor predictable.
- Average returns are close to zero, over various horizons and entry points.
- Returns are not predictable on the basis of the underlying crypto environment or their initial performance.
Introduction
Academic and institutional journals are full of papers analyzing equity market returns in systematic and comprehensive ways. But crypto markets — despite their more democratized participation — have received little comparable attention.
In this blog post, we at Jump Crypto start contributing to that nascent body of knowledge, focusing on financial returns for new tokens. Crypto is special in so many ways — and one such way is the low barrier to entry for participating in new projects. While only well-connected institutions can climb such barriers in traditional markets, any crypto participant can buy a token when it launches.
Looking at the last several years of crypto history, we want to understand whether there are systematic or predictable returns when buying new crypto tokens. Or, more succinctly: are markets for new crypto tokens efficient or not?[1]
Some will say "no" and cite stories like that of the Dogecoin millionaire Glauber Contessoto. Others will say "no" but for the opposite reason, citing various rug pulls in the space. Still others will review these sentiments and say "no" for a third reason — an asset class this volatile cannot be efficient. (Note: we would have guessed "no," too.)
But the historical data contradicts us all. Markets for new crypto tokens look efficient, as financial returns to those tokens are neither systematic nor predictable. Even on the frontiers of the crypto landscape — dominated by memes and emojis — the market’s invisible hand equilibrates the supply and demand of capital.
To study this, we take the perspective of the mainstream Bitcoin holder who deployed capital to new projects over the past several years and we examine the subsequent financial returns. This sort of exercise is traditionally bedeviled by survivorship bias, i.e. the tendency to over-sample and thus over-study the winning tokens because the losing tokens have been delisted and forgotten. But we construct a comprehensive sample that is robust to such bias.
After running the historical data, we find four key facts:
- Returns to buying new tokens are highly skewed — but average out to approximately zero.
- Except in some extreme cases, those returns do not depend on the entry strategies.
- New token returns are not predictable based on the underlying crypto environment in which they are launched, except in some extreme cases.
- Those returns are also not predictable based on the relative performance of their peers.
So what should a crypto participant take away from this? Well, we don’t give financial advice on this blog. But our takeaway is that the same ingredients needed for success in traditional markets — thorough due diligence on an individual trade and accurate predictions about the macro environment — are needed here too. Crypto may be special, but not in this way.

Methodology
To do any convincing analysis, the core issue to solve is survivorship bias, i.e. constructing a database of tokens based on their eventual prominence. For instance, if we study the financial returns of all tokens listed on Binance, we will only be studying the highly successful tokens that cleared Binance’s listing criteria and we will be omitting all others. Thus, we must ensure our database contains all tokens that could ever be viable targets for retail buyers.
Given the central importance of this task, we construct two entirely-independent databases, one from Coingecko and one from Coinmarketcap. Coingecko and Coinmarketcap are the two industry leaders in tracking crypto tokens — and relying on both independently provides the paper with an extra layer of defense against survivorship bias. Further details on the two providers can be found in the footnotes.[2]
With these databases, we focus on a population of 3,759 tokens that listed between mid-2013 and the end of 2021. We similarly measure returns from the token’s inception until the end of 2021. This set of tokens is created from both manual and programmatic efforts to remove stablecoins and derivative tokens (e.g. cross-chain wrapped coins, mirrored tokens, leveraged tokens, etc). We also adjust for the renaming or rebasing of tokens, e.g. when Aave’s token LEND was redenominated to AAVE at a 100:1 ratio in October 2020.
Finally, we turn to our measure of financial returns. As mentioned, we take the perspective of a mainstream Bitcoin holder who measures their financial returns to holding a new token in Bitcoin-denominated terms.[3] To make this concrete, suppose one coin of token ABC costs 1 BTC today and 0.5 BTC tomorrow. This would be recorded as a -50% return for token ABC. Such a perspective is useful because it controls for general crypto sentiment (which would cause both the prices of ABC and BTC to appreciate). Thus, it sharpens the focus on the relative value of new tokens for a crypto-native trader.[4]

Skewed but Balanced Returns
So without further ado: what were the historical returns to buying new tokens?
For the analysis, we assume our representative individual purchases any token on the same day that it either crosses a total market capitalization of $20 million or 0.02% of the total crypto market capitalization. (The latter generally binds before late 2017, when the total crypto market capitalization was below $100 billion.) This creates a sample of just around 2,000 tokens purchased, which are equally weighted in the historical portfolio.
The returns — measured in Bitcoin and across horizons of one month, one quarter, and one year — are presented below:
Time HorizonMean ReturnMedian Return% Under Water1M12%-24%65%1Q6%-43%71%1Y-14%-78%84%
There are two key takeaways. First, the vast majority of new token purchases — 80%, at the one-year mark — are underwater and yield negative returns. The 80-20 split is well-known to venture capitalists in traditional markets, and so it is interesting to see the same split emerge in crypto.
Indeed, we can visualize the heavy skew in token returns by presenting the density plot (i.e. histogram) of returns below. The left pane represents all tokens, while the right pane focuses only on returns up to +500% for enhanced clarity.
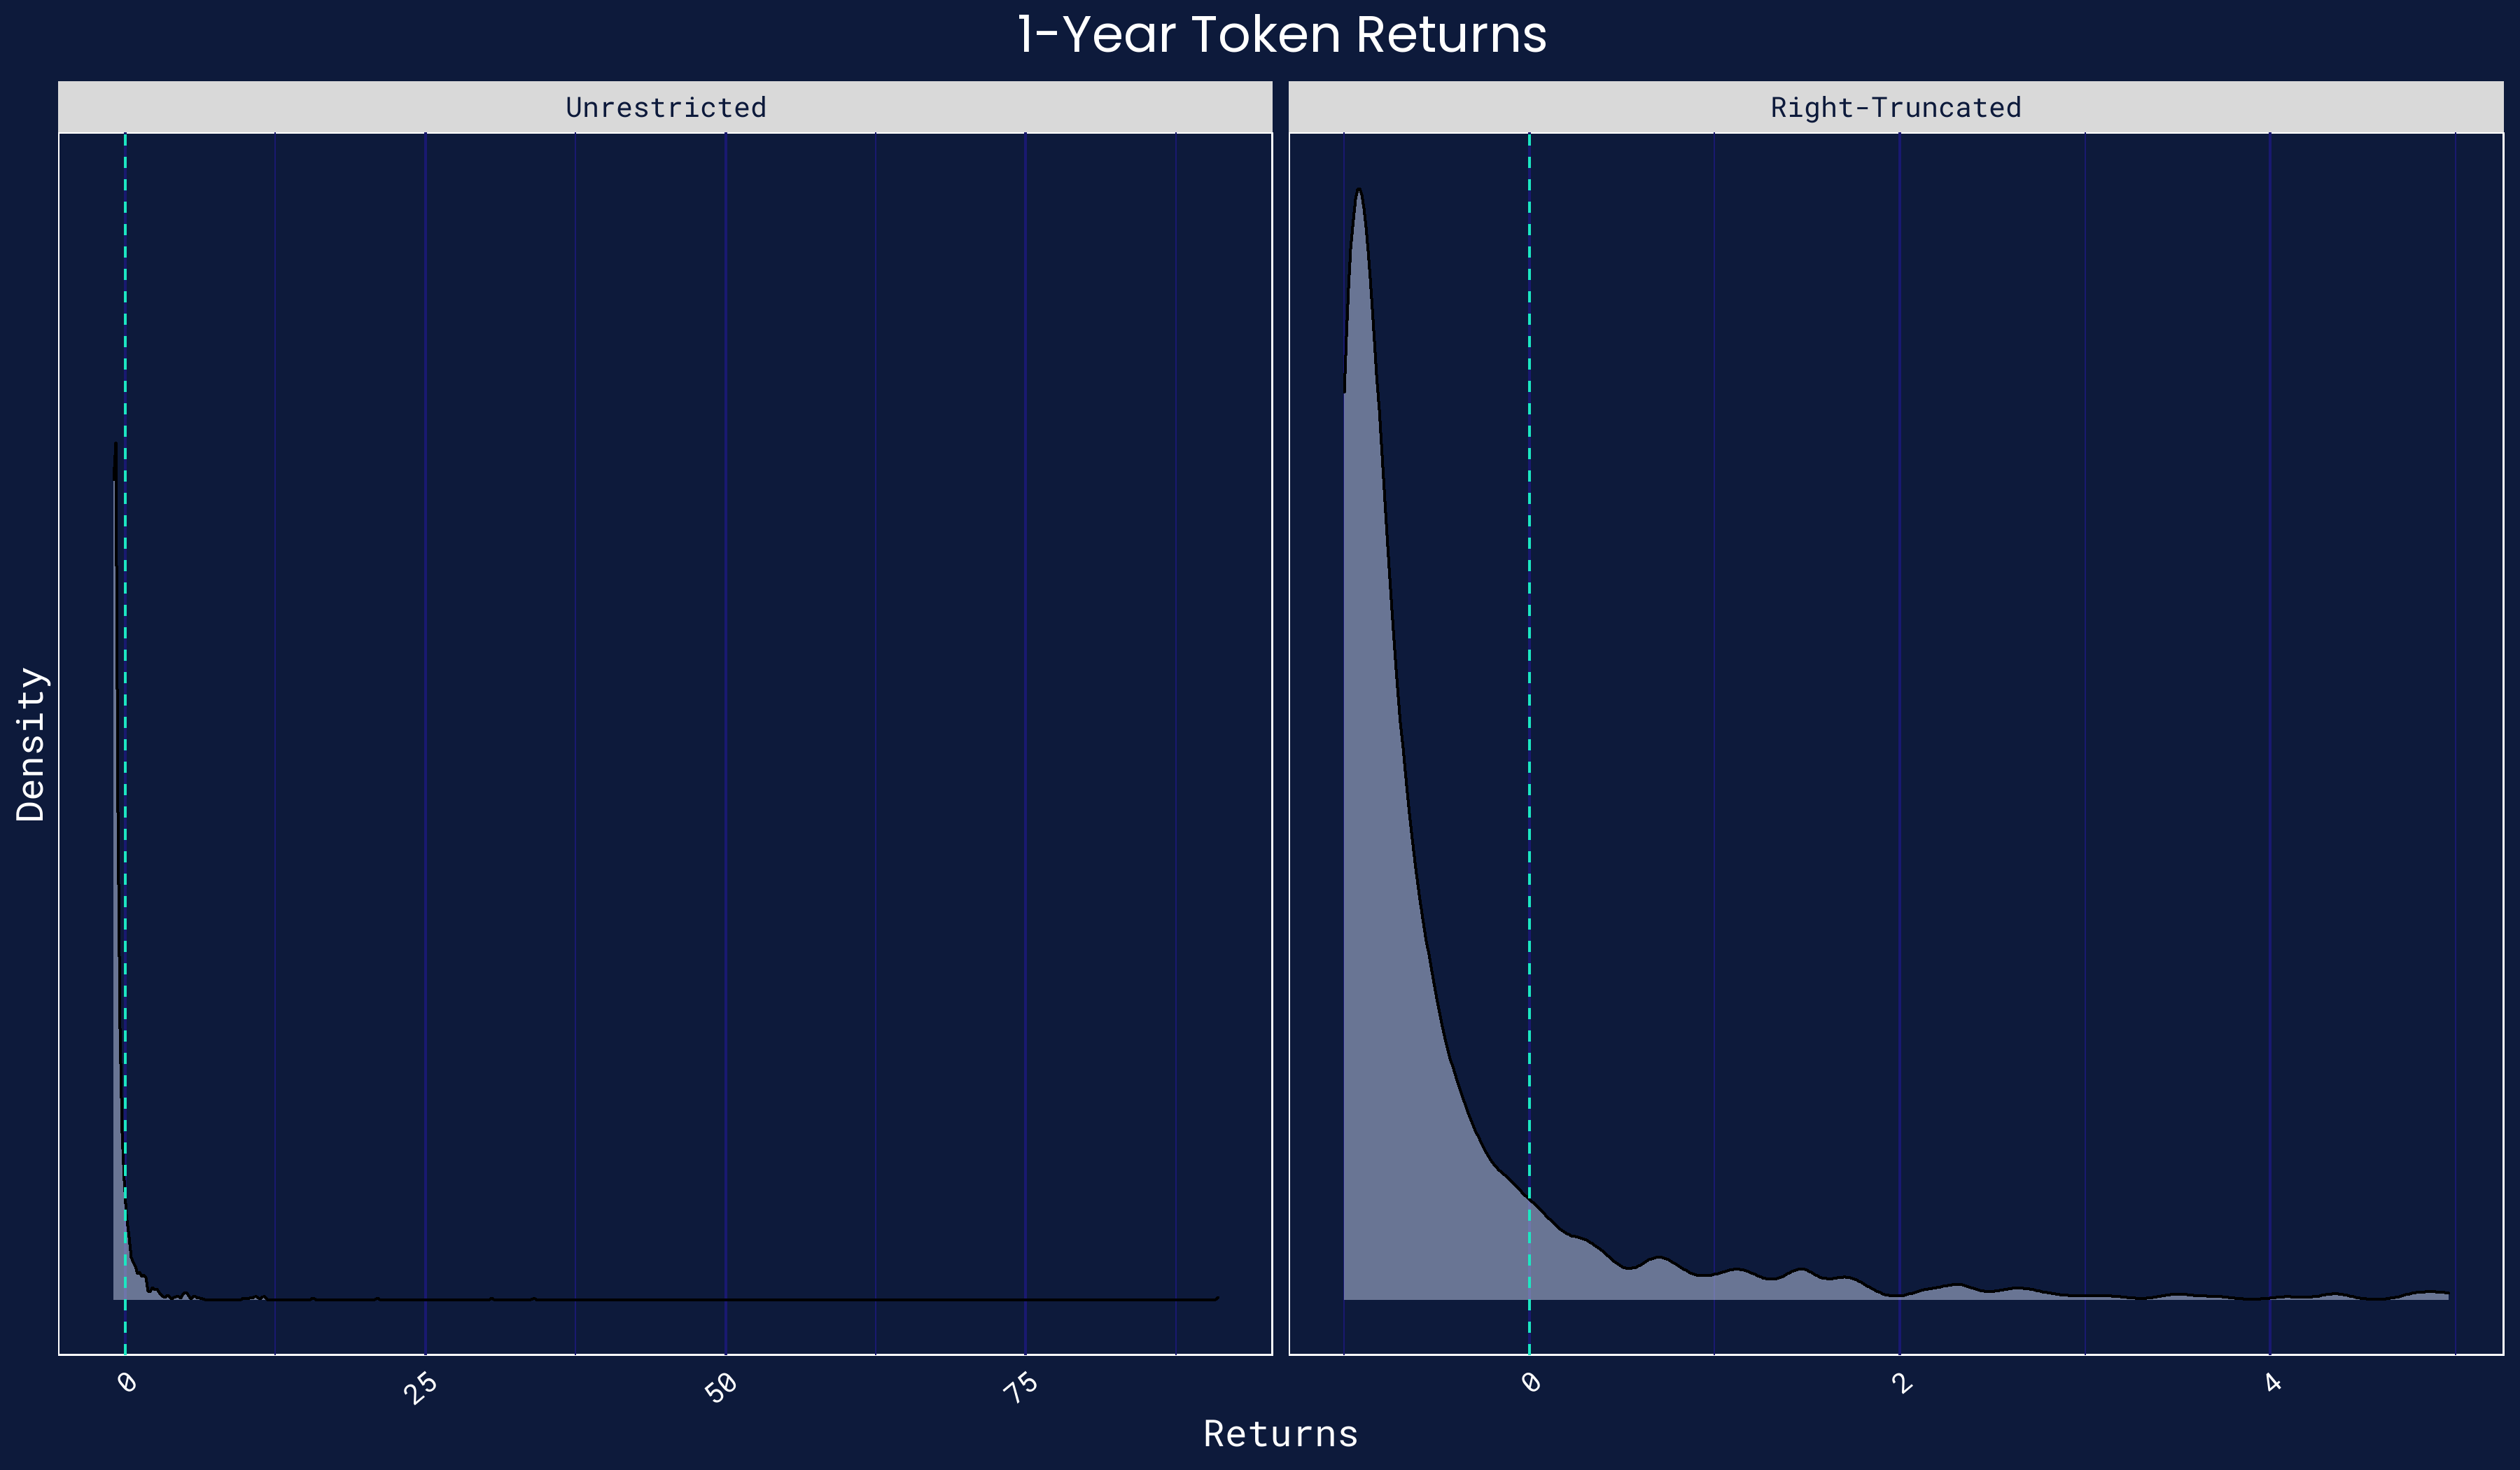
Thus, while there are a few outliers on the right tail — led by Axie Infinity, with a 9,000% one-year return — most tokens have had far more middling returns. Returns holistically are more impressive when denominated in dollars rather than Bitcoins, but this is of course due to the general run-up in crypto markets over the last several years.
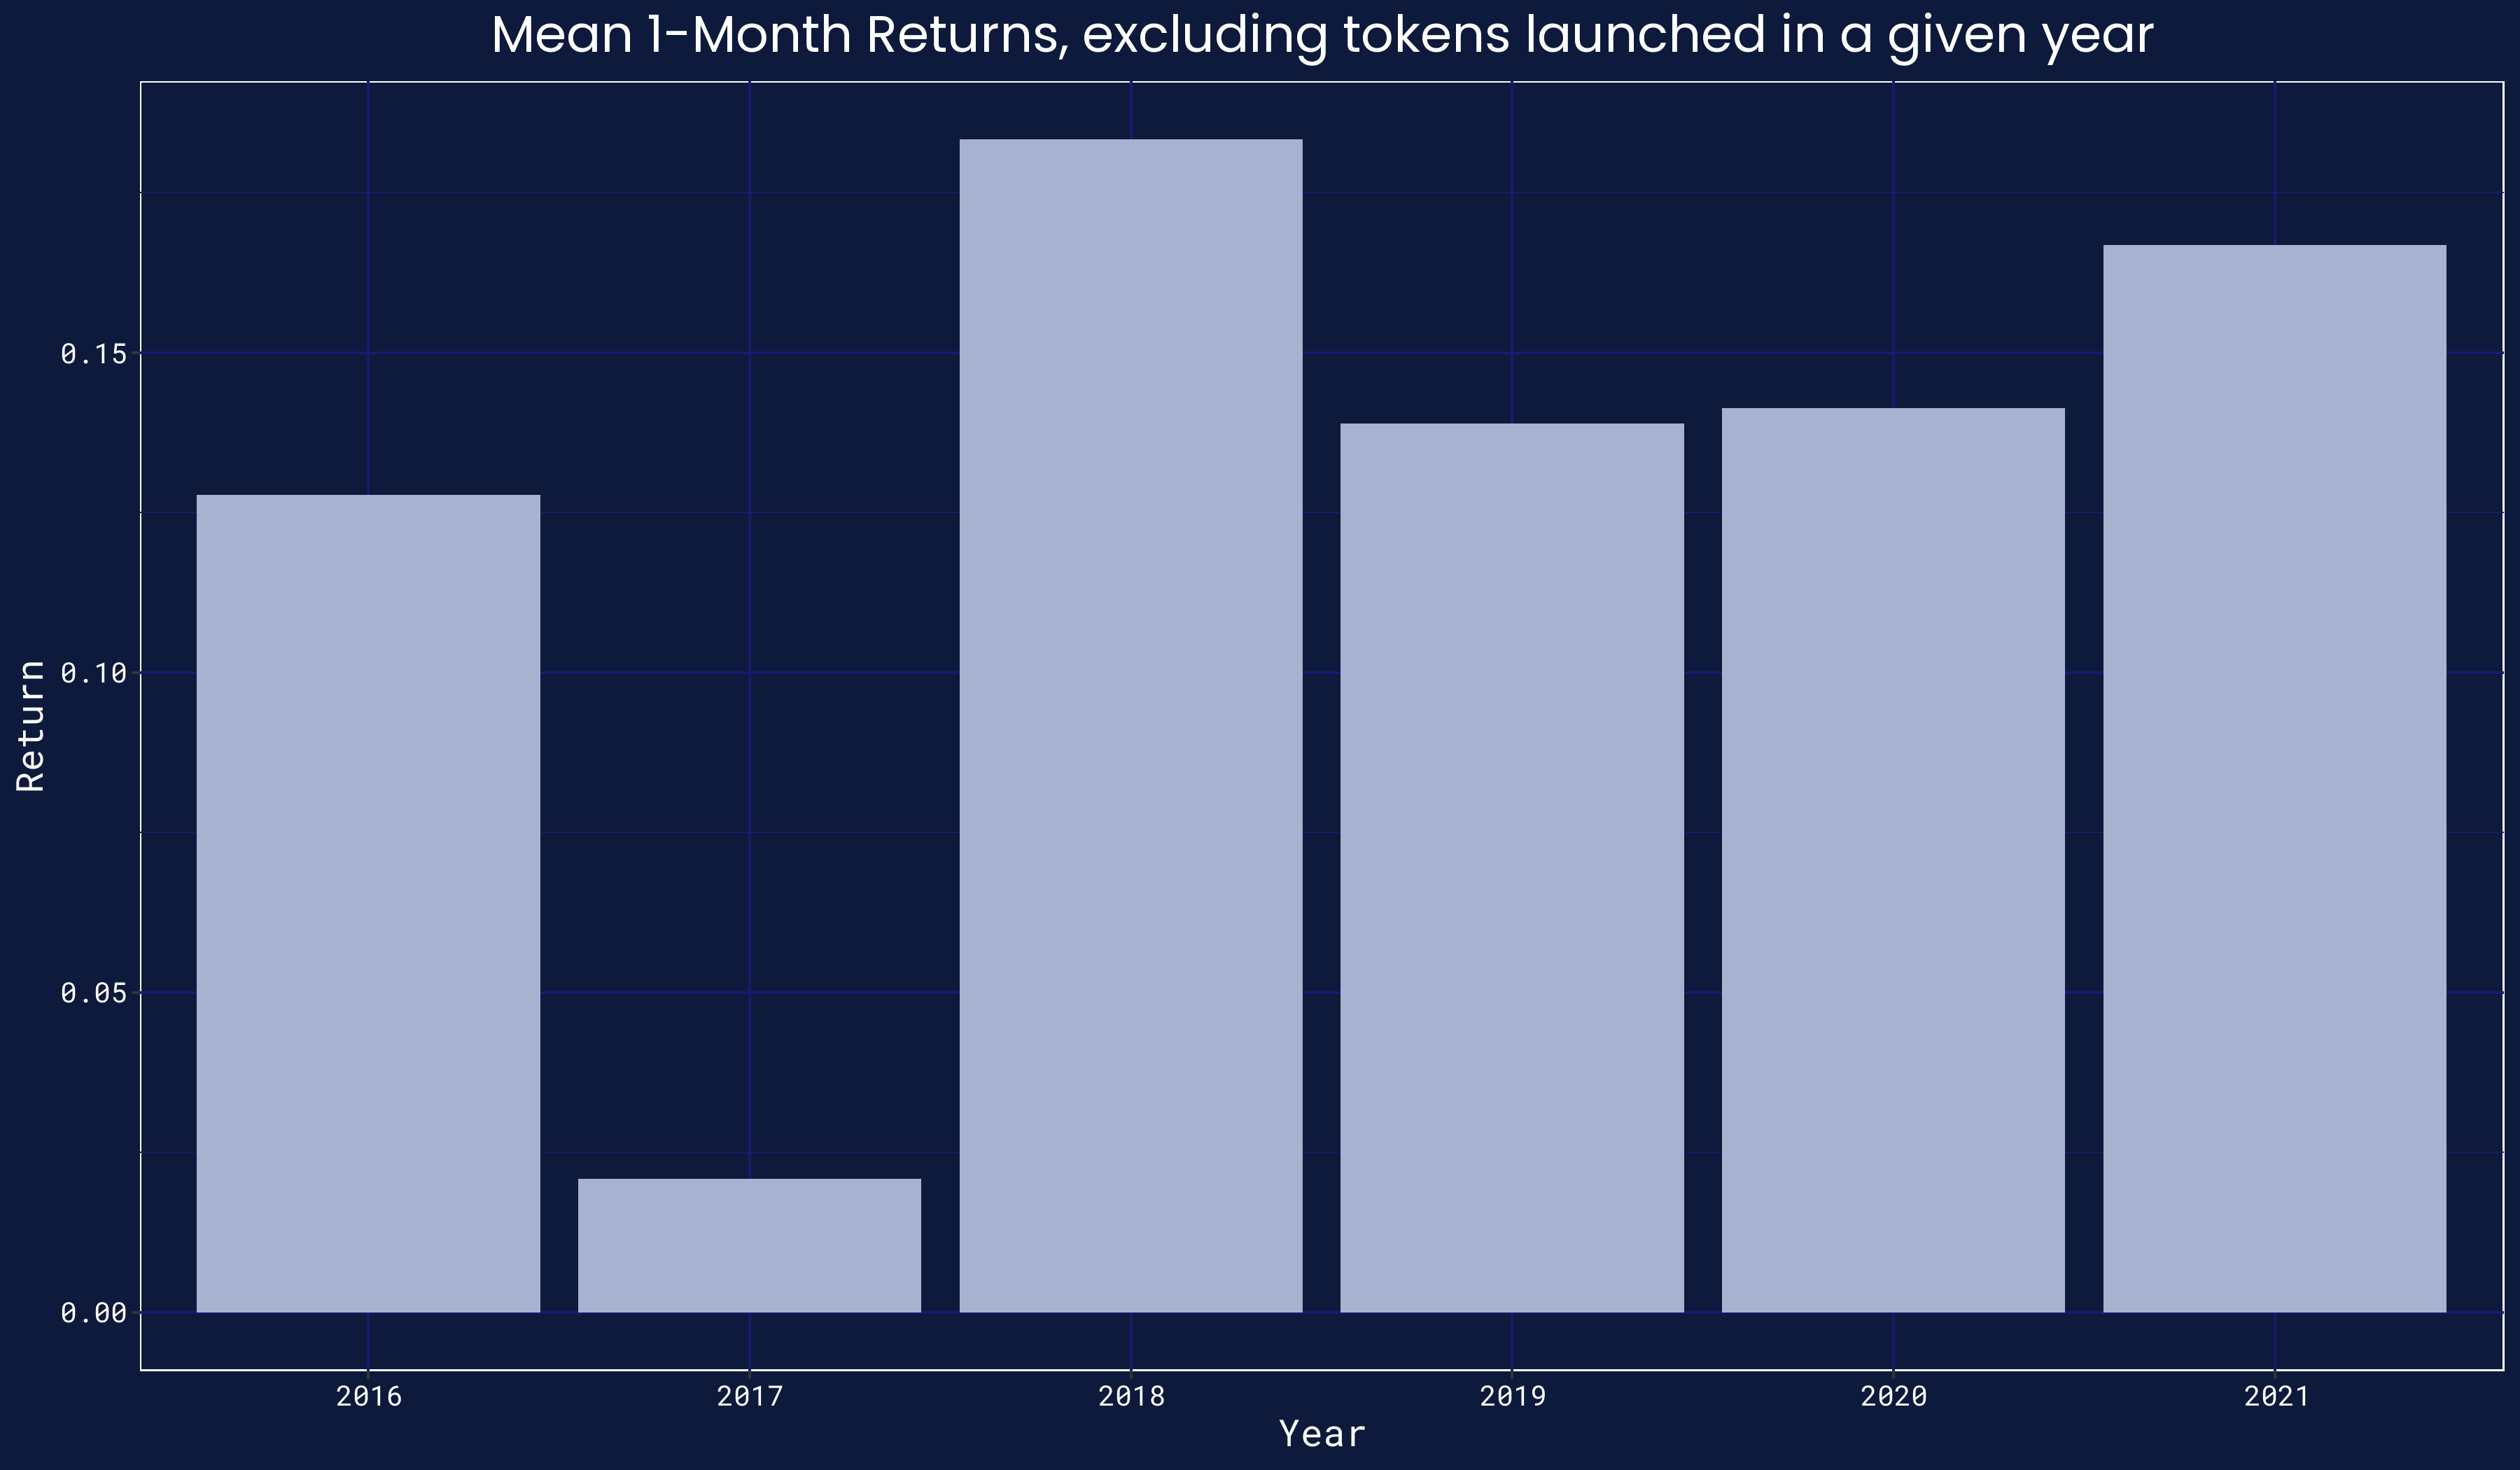
Second, the average return to buying a new token is close to zero. In particular, the one-quarter return and one-year returns are statistically indistinguishable from zero. Interestingly, the one-month return is statistically positive. But, on further examination, this is entirely driven by the tokens that launched in late 2017, during the ICO craze. To visualize this, we again compute the same one-month return to buying tokens — but we drop tokens launched in 2016, then 2017, etc. The results are below. By dropping tokens launched in 2017, the one-month return immediately plummets from an impressive 12% to a statistically-insignificant 2%.
Thus, the market for new tokens does not yet look inefficient. In this first check, returns are highly skewed, as is expected for new products — but they are approximately zero in the aggregate.
Entry Points and Timing
Not every trading strategy will purchase tokens immediately when they cross a market capitalization of $20 million. More aggressive ones will go for lower market capitalizations, and more conservative ones for higher ones. Moreover, some strategies may prefer to wait a few days, perhaps to let the initial hype die out. Do these adjustments to the entry conditions improve returns in the historical data?
For the most part, no. To study this, we repeat the same exercise of constructing an equal-weighted portfolio of new tokens. However, we first vary the needed token market capitalizations from the lesser of $10 million or one basis point of the total crypto market capitalization, to $100 million or ten basis points. Second, we further vary the entry delay from zero days to twenty-eight days.
The heatmap plot of average returns for a one-year holding period, across the various permutations, is below. Interestingly, they show one trend — the lower the market capitalization threshold, the better. While most portfolios have below 0% returns, the ones that buy tokens at earlier stages perform above average — and in a few rare cases, substantially above average.
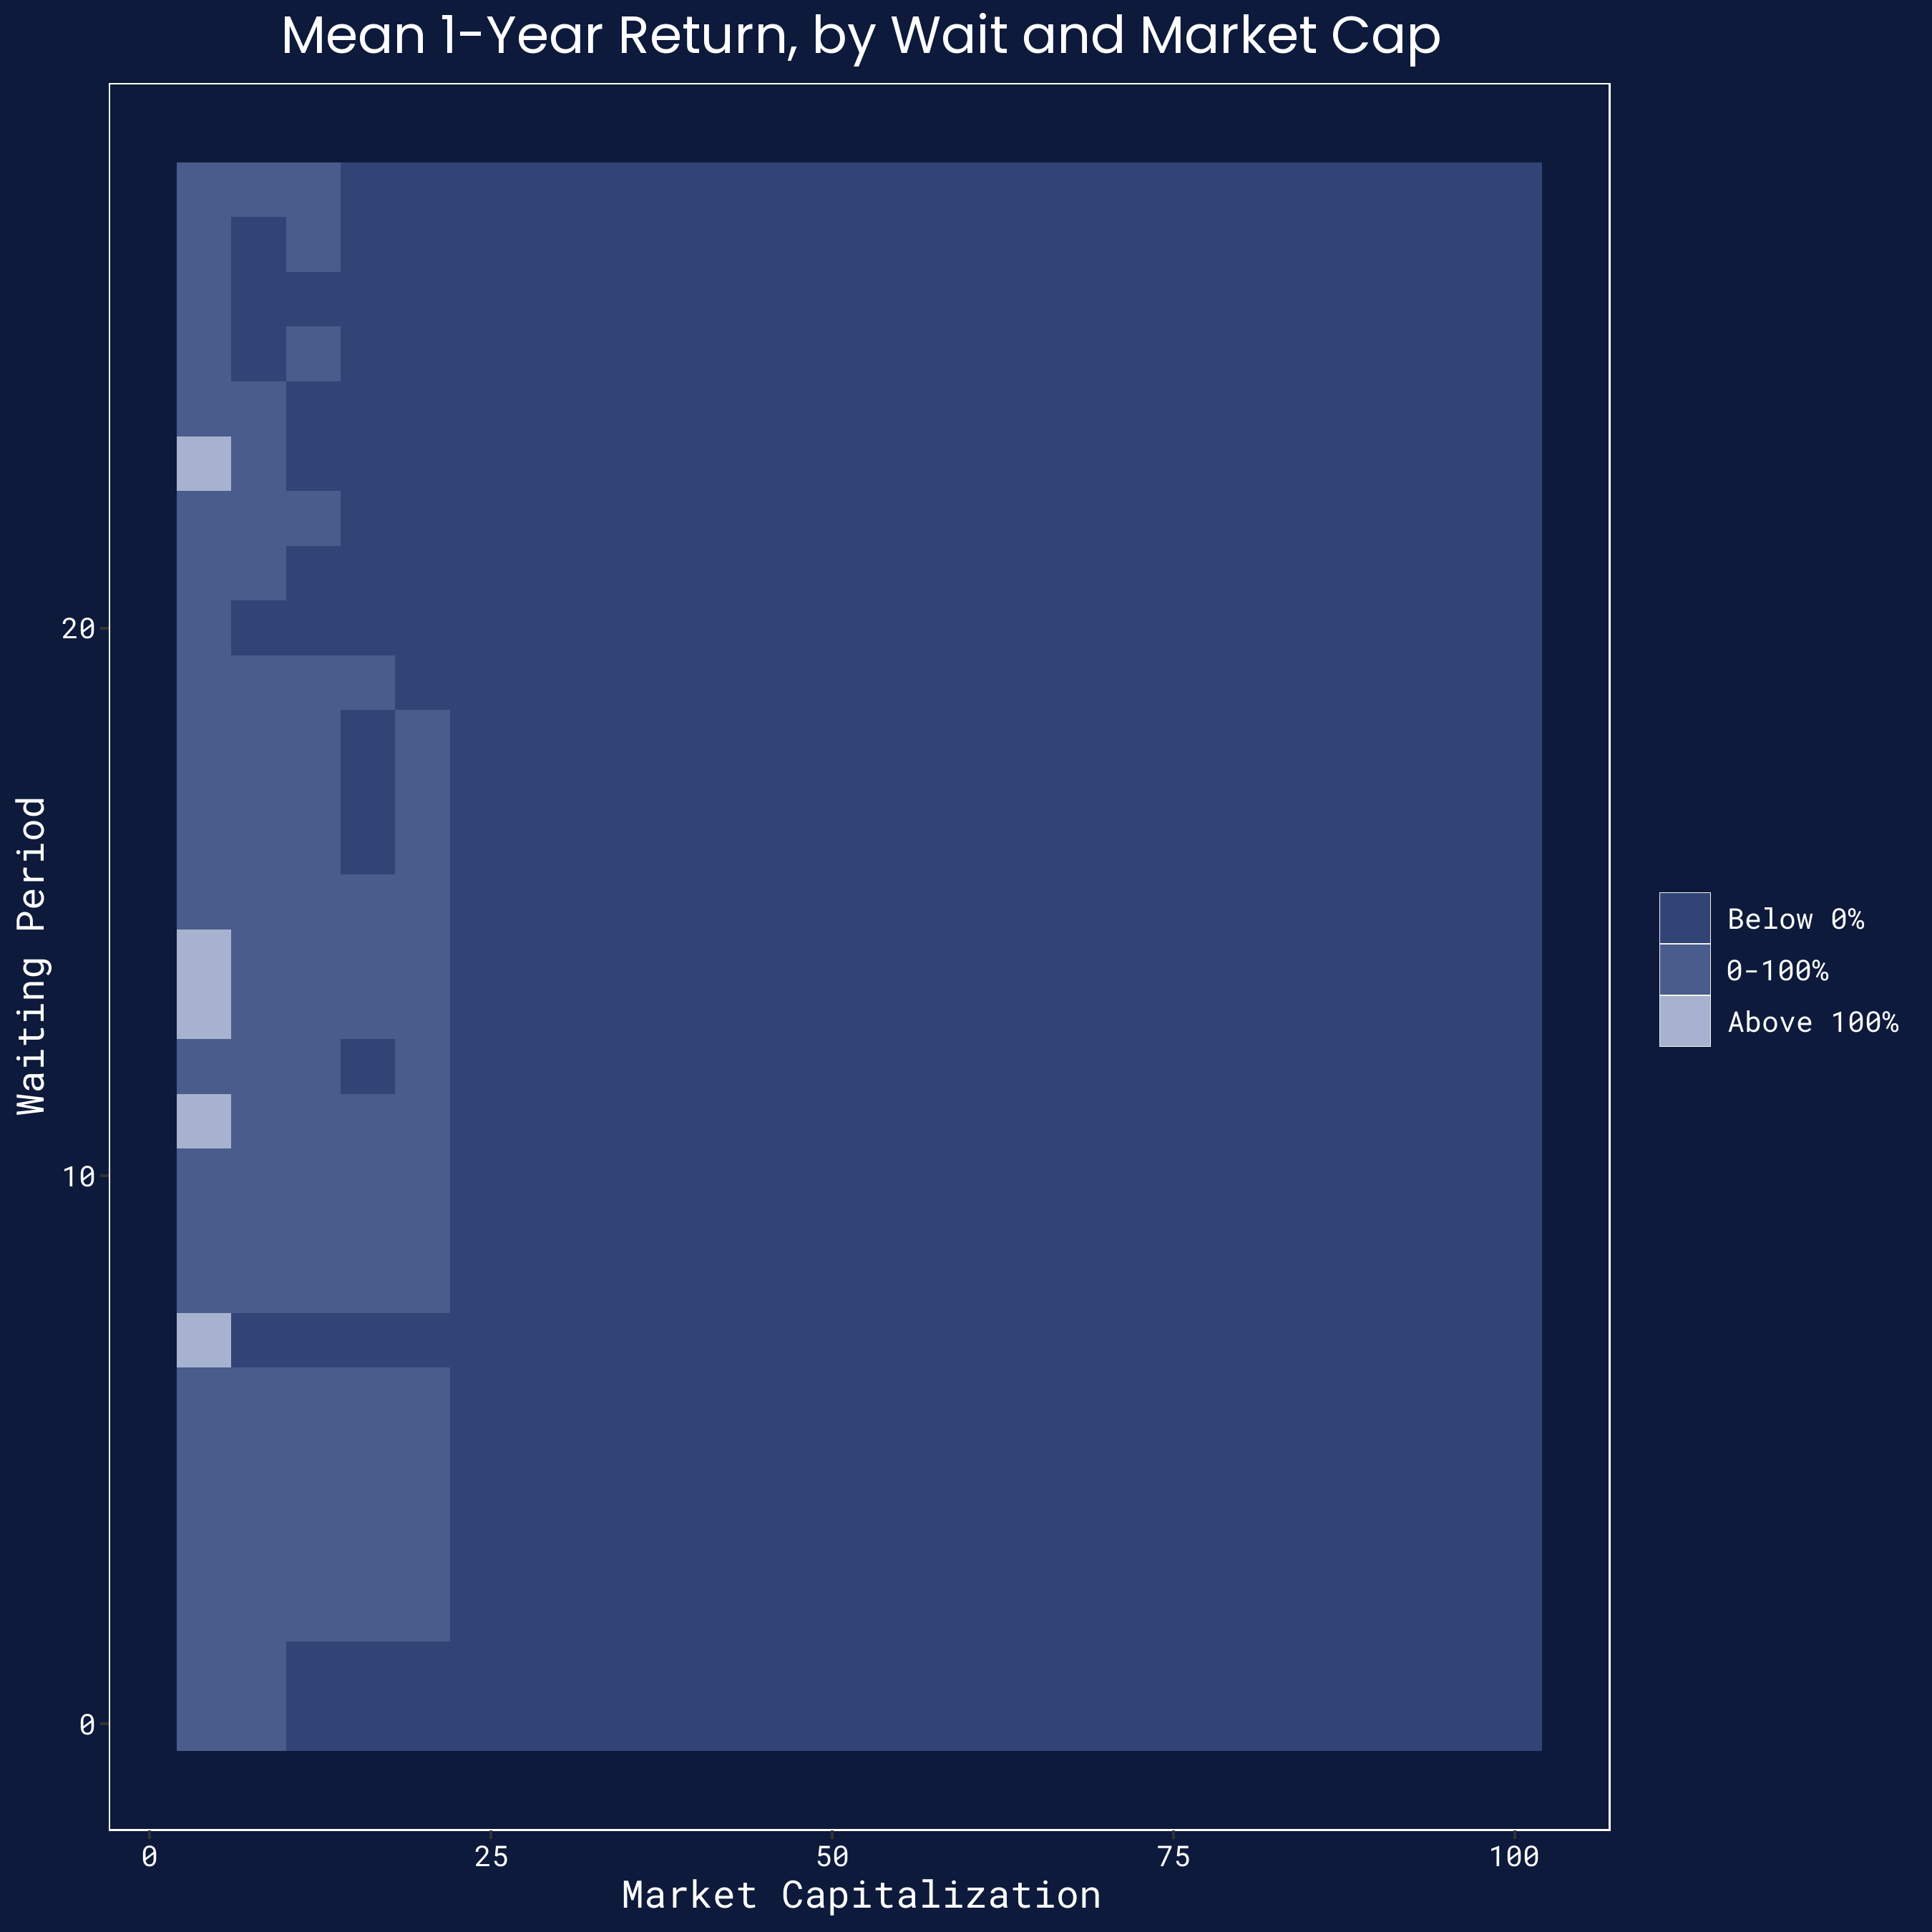
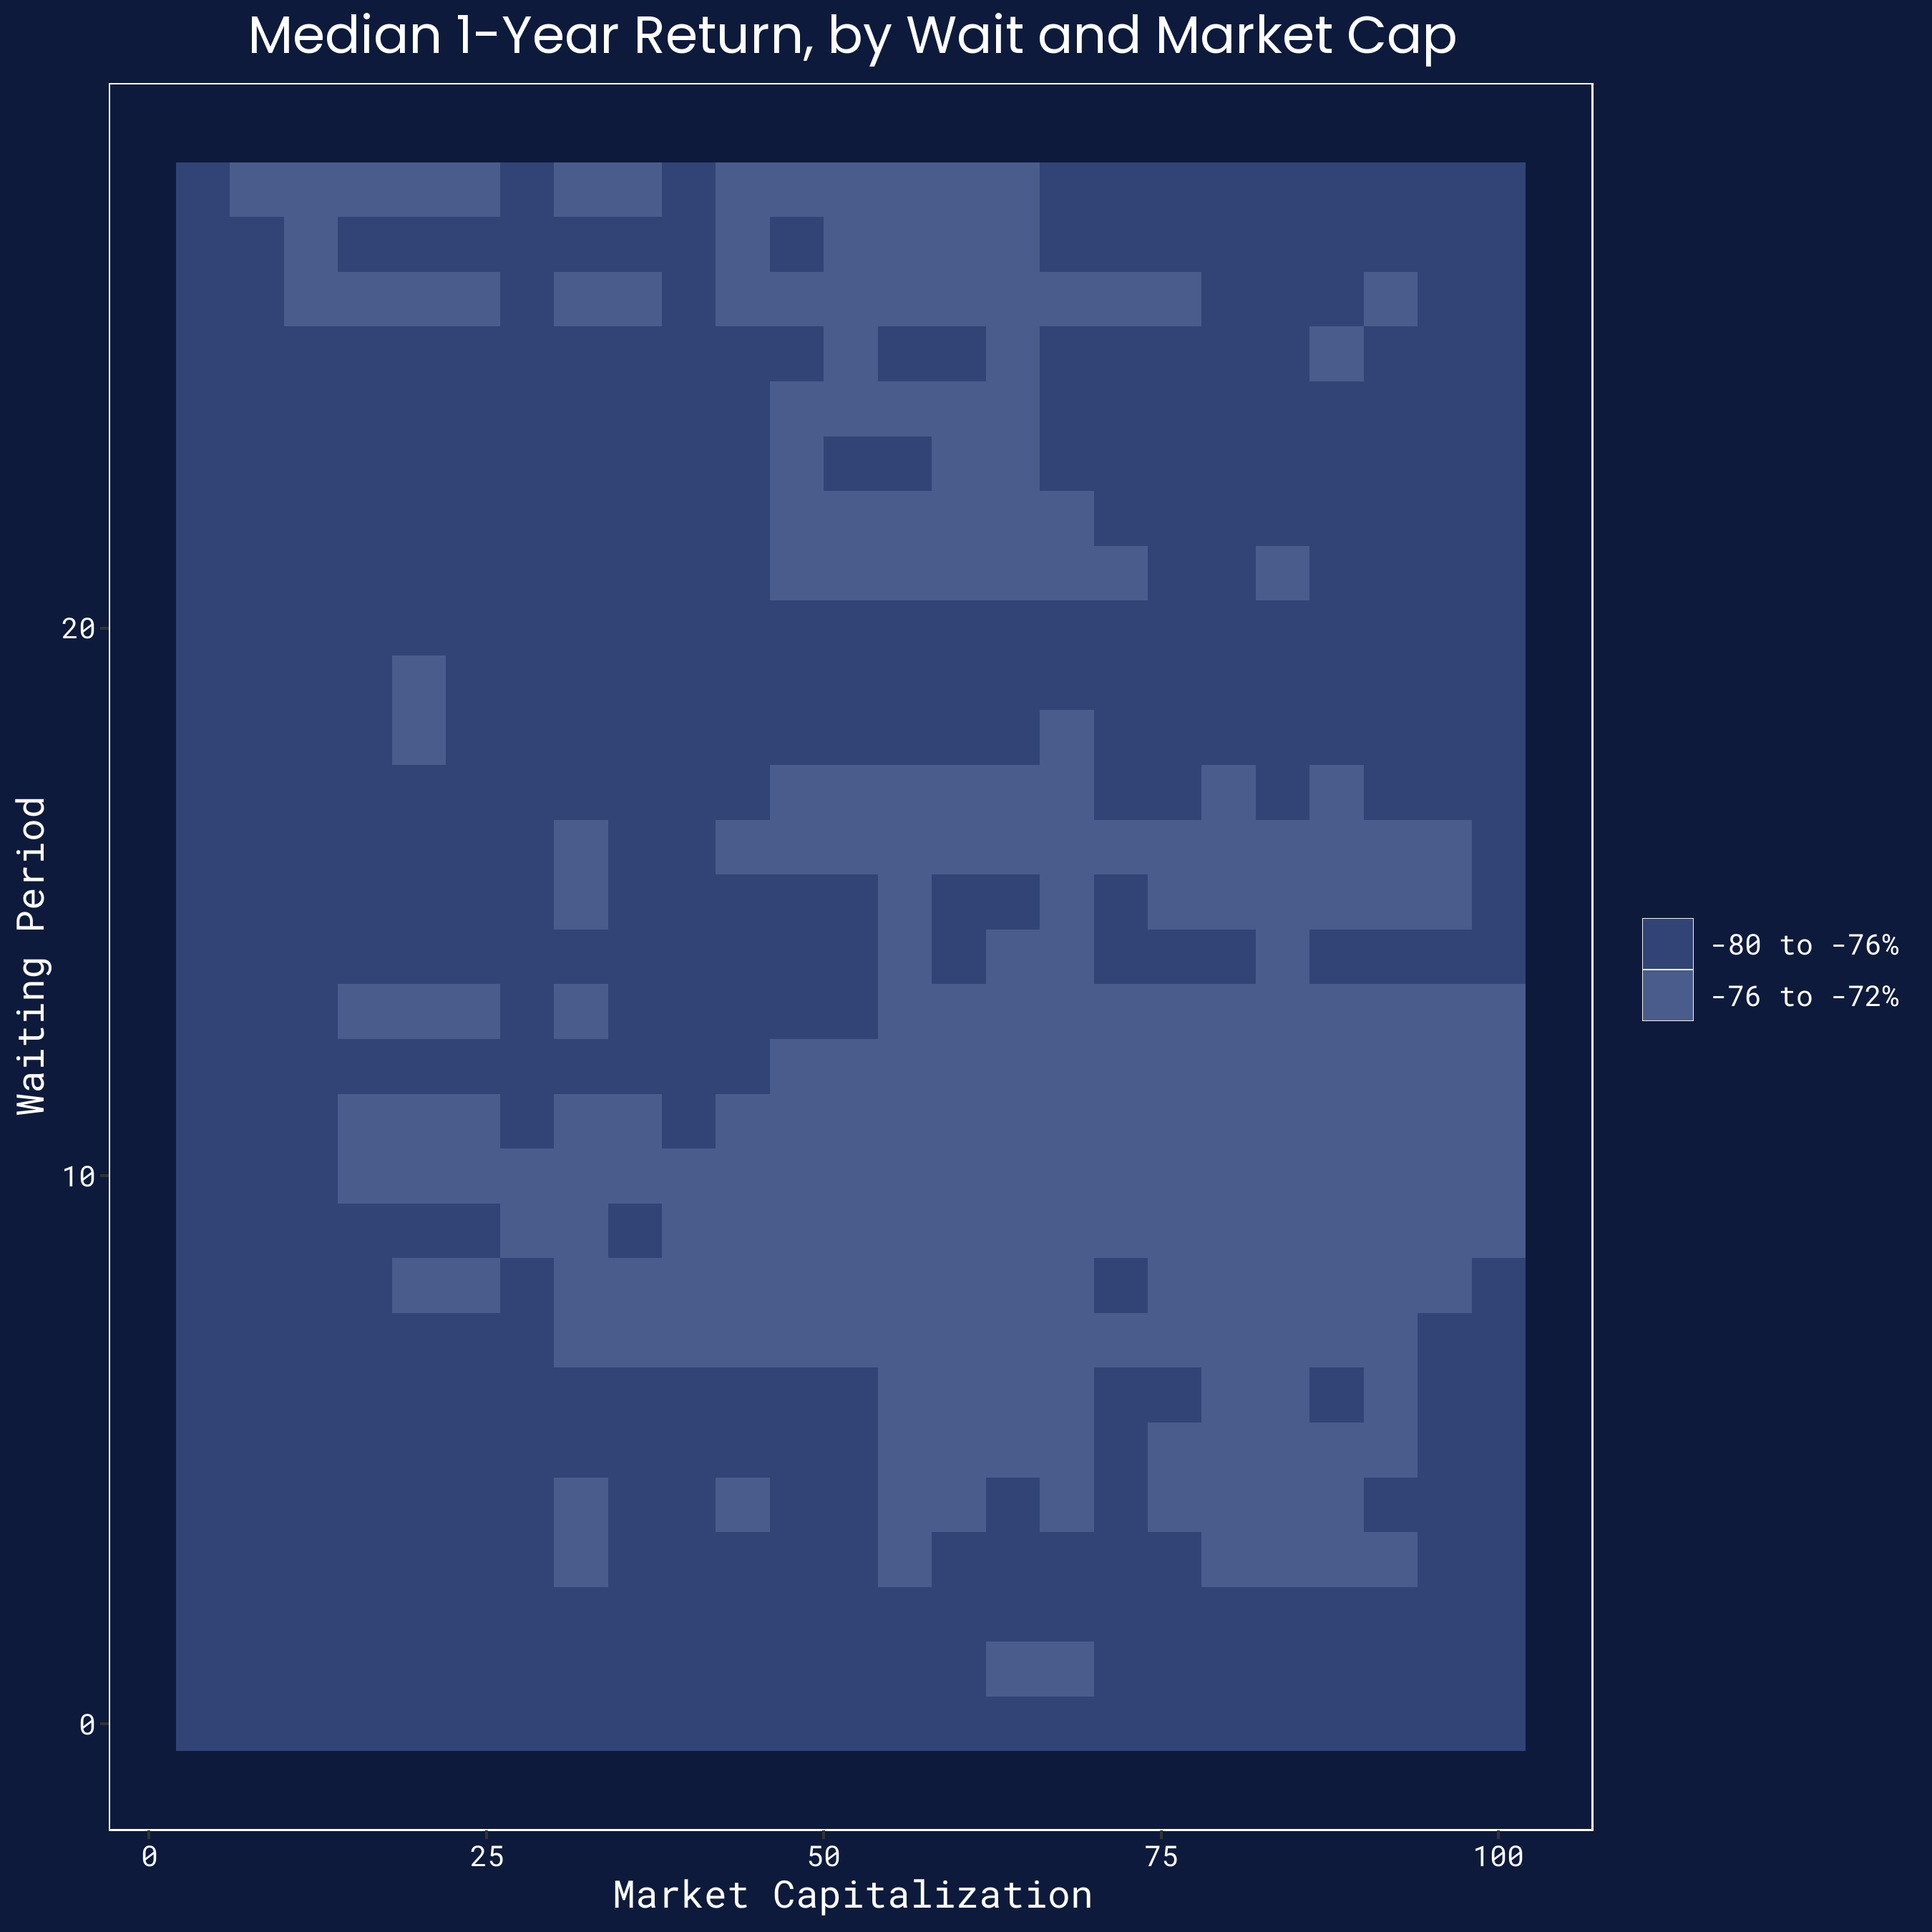
However, this argument has its limits. First, it is often tough to purchase tokens with very small market capitalizations. Such tokens are listed on tiny exchanges, and entail substantial execution costs to trade (particularly in meaningful size). Second, it is possible that the coverage of tokens at such early stages by Coingecko and Coinmarketcap is more imperfect, which would skew the results — although both do track tokens well below $10 million routinely. Third and finally, this result is entirely driven by getting into a very few tokens early. For instance, if we compute the same heatmap but utilize median rather than mean returns, virtually all portfolios yield the same result — median returns are around -75%, corresponding to about 80-85% of tokens being underwater at the one-year mark.
So we continue concluding that there are no easy returns in purchasing new tokens. Portfolio returns were heavily skewed in the historical data, leading to positive outcomes in a few rare cases — but generally leading to mildly negative ones in most cases.
Environmental Predictors
So maybe the market for new tokens looks efficient in absolute terms. But what about relative terms? In particular, are there environment-level predictors of returns for new tokens?
For instance, many venture capitalists argue in favor of bear markets over bull markets. One view is that bear markets prevent initial token valuations from becoming frothy, which leads to better returns over the long run. A second and stronger view is that bear markets dissuade all but the most capable of protocol builders, and thus the tokens that launch are sounder and more successful.
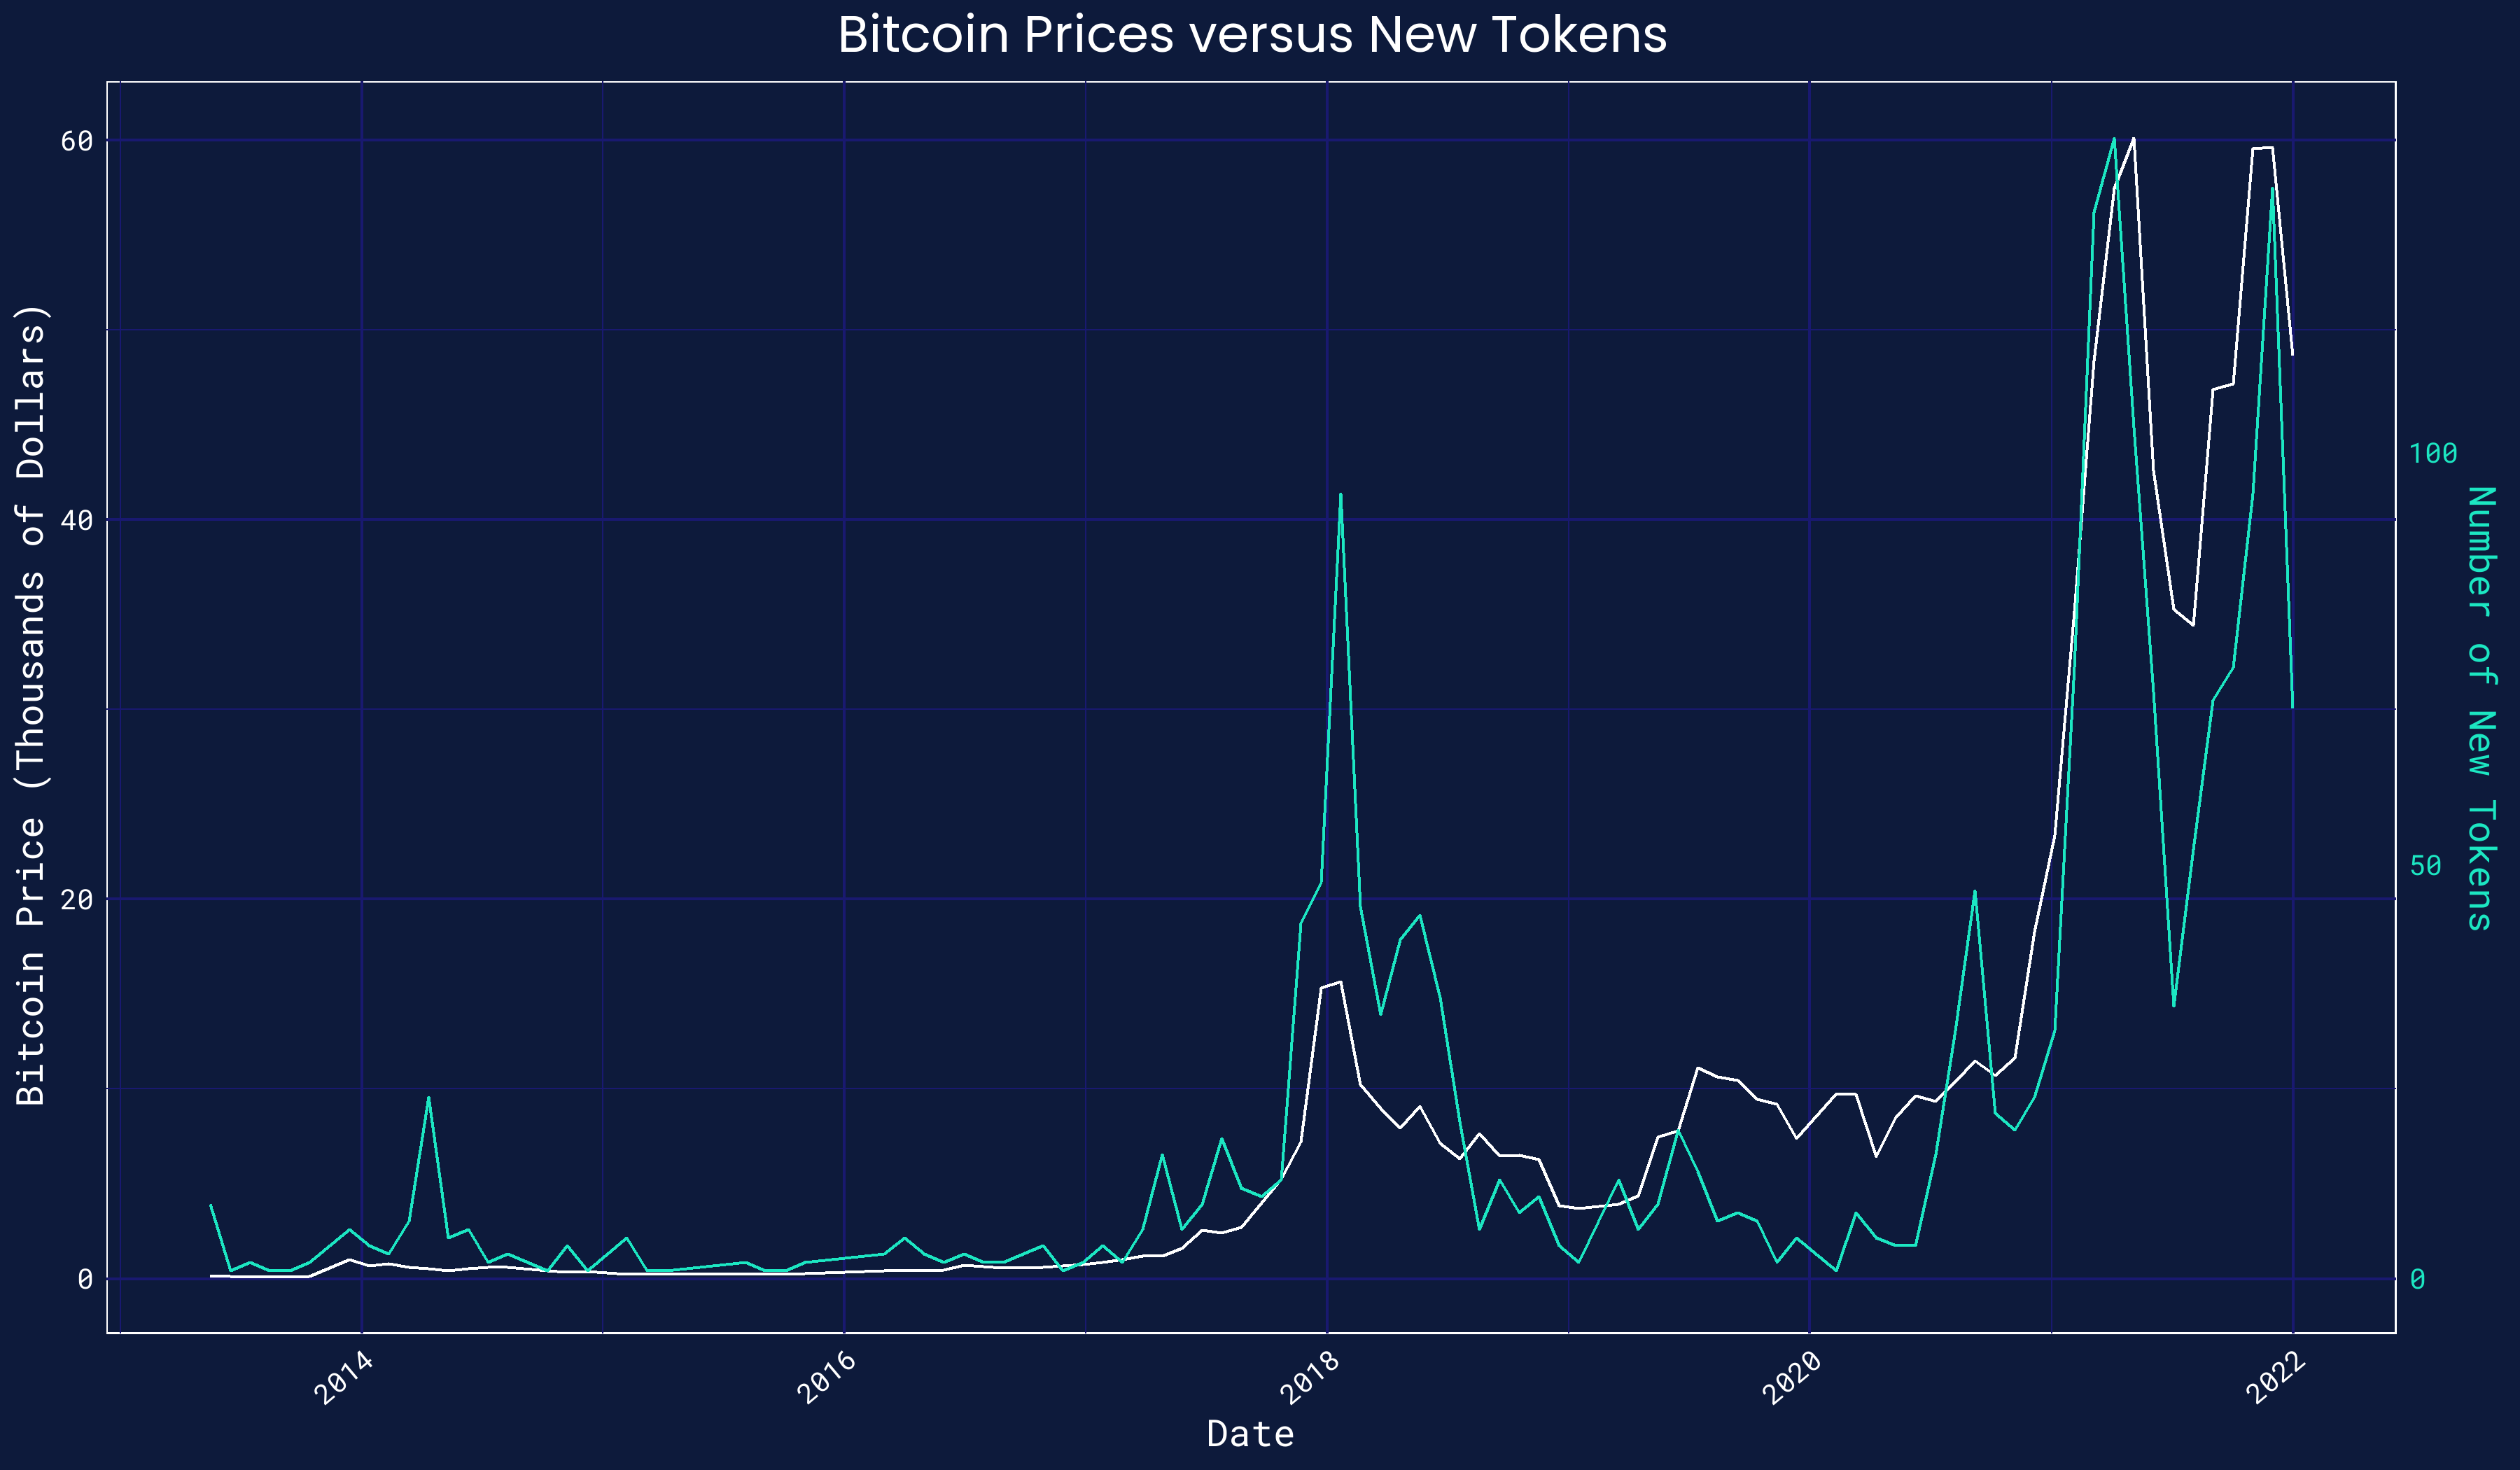
There does indeed seem to be some clear cyclicality in new token launches. To illustrate, we plot the monthly price of Bitcoin versus the number of new tokens that launch (via our standard threshold of market capitalization). The graph below shows that the two closely track one another!
And yet, when it comes to returns for these new tokens, the answer is no — there are no systematic environment-level predictors, at least at moderate horizons. To study this, we bucket new tokens into thirty-day "cohorts," and compute a market capitalization-weighted portfolio. Per the usual approach, we then measure Bitcoin-denominated returns at the one-year horizon. As a brief aside, the most successful cohort is one in September 2015, with a single member: Ethereum. The second most successful cohort spans mid-September to mid-October 2019, which includes Terra’s LUNA token and the Celsius token (in addition to a few heavily-underperforming ones like Breezecoin).
Using the Spearman correlation, we correlate the one-year returns to these portfolios with four key environment-level indicators at the portfolio’s inception. These four indicators are the dollar price of Bitcoin, the number of new tokens in the portfolio, the total market capitalization for crypto, and a trailing measure of realized volatility in Bitcoin prices. All four are statistically insignificant!
There is some nuance here. When computing the correlation with two-year returns, these variables (except volatility) are statistically significant, although with small and negative point estimates of around -0.3. This points to possible market inefficiencies at longer time horizons. However, a two-year return also removes much of the data and thus over-samples from the 2017 ICO boom.
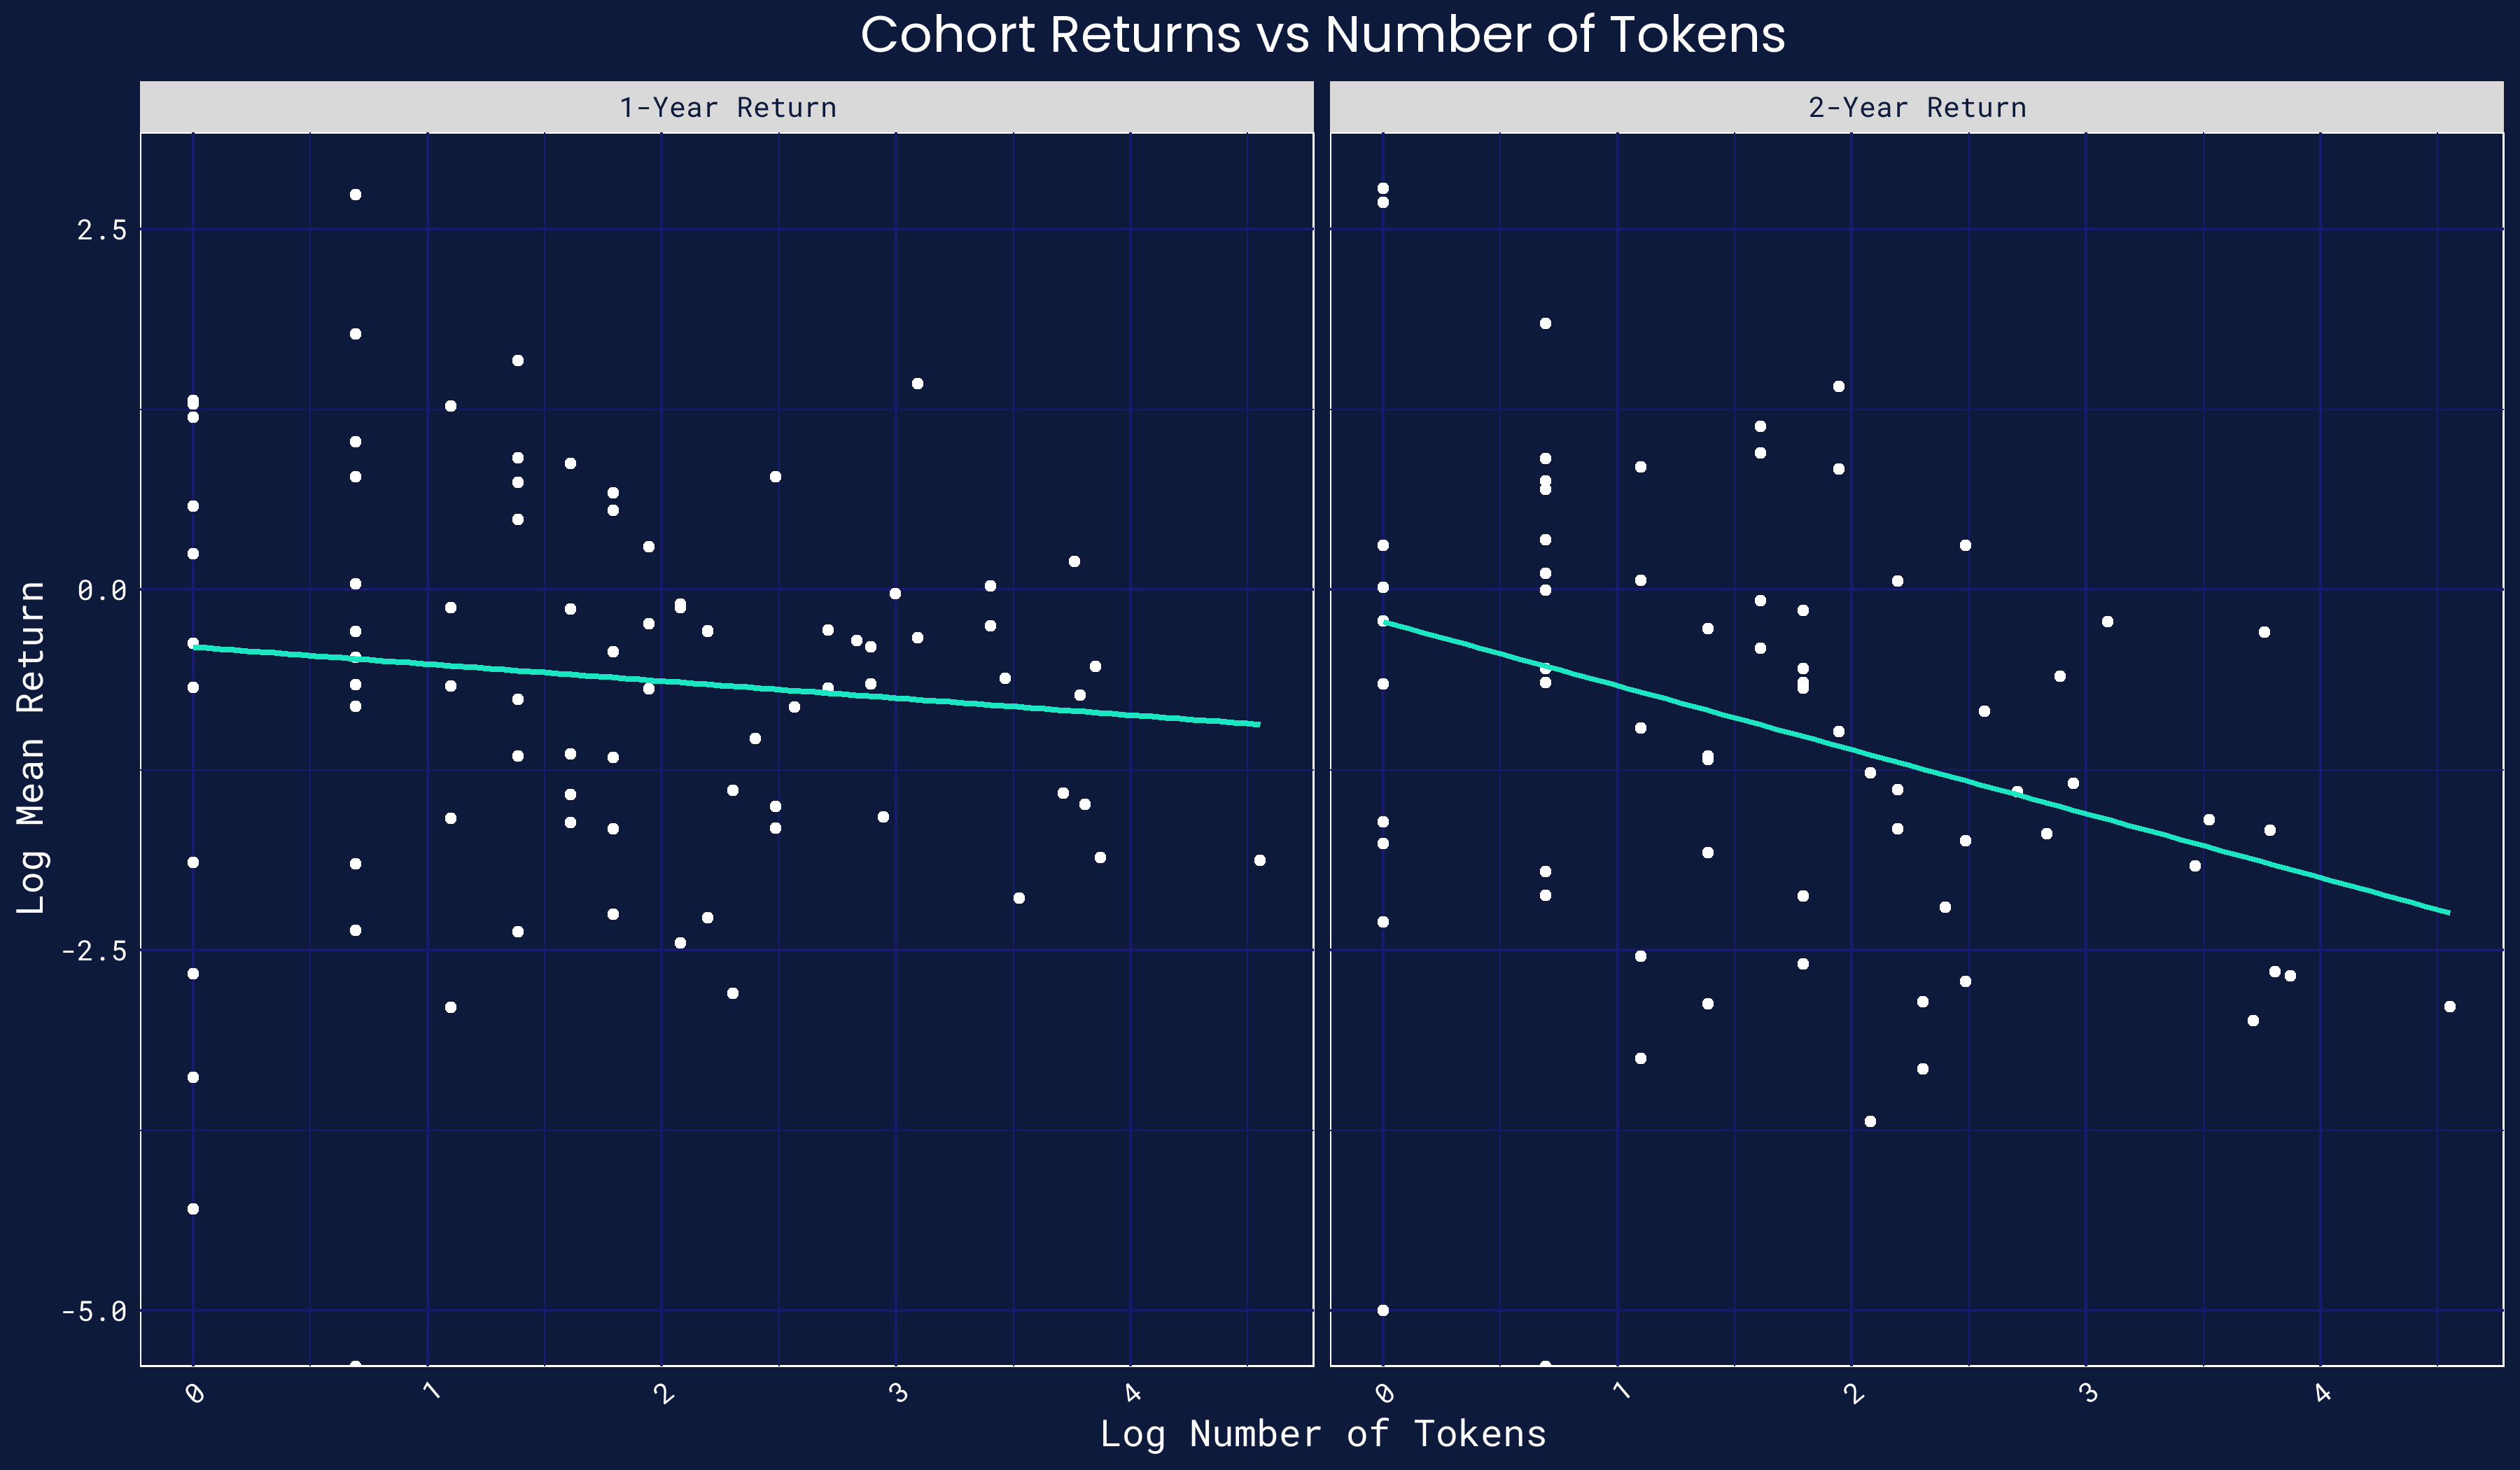
These results — particularly the baseline one — seem counterintuitive, but consider some visual evidence. We present below a scatterplot of the gross returns, at the one- and two-year horizon, in logarithmic terms versus the number of tokens in logarithmic terms, for each thirty-day cohort.[5] As the graph and the corresponding best-fit line show, there is really no relationship in the data at the one-year horizon. There is a weak relationship at the two-year horizon, but it is not particularly tight or impressive.
Once again, the market for new tokens does not have clear inefficiencies. Except in some extreme cases, tokens born in bear markets or with few siblings do not outperform tokens born in bull markets or with many siblings.
Pricing Predictors
Finally, we try one more test. Does the initial performance of a new token, relative to its cohort, predict its subsequent performance? In other words, are there at least some short-term inefficiencies that we can see in the historical data? For instance, suppose a given new token is overhyped. This token might outperform its peers at launch but then crash later — and so its initial positive performance would be followed by a negative one, relative to its peers. Such a finding, if systematic, would provide some evidence that new token markets can be inefficient over short horizons, showing perhaps mean-reversion (or momentum).
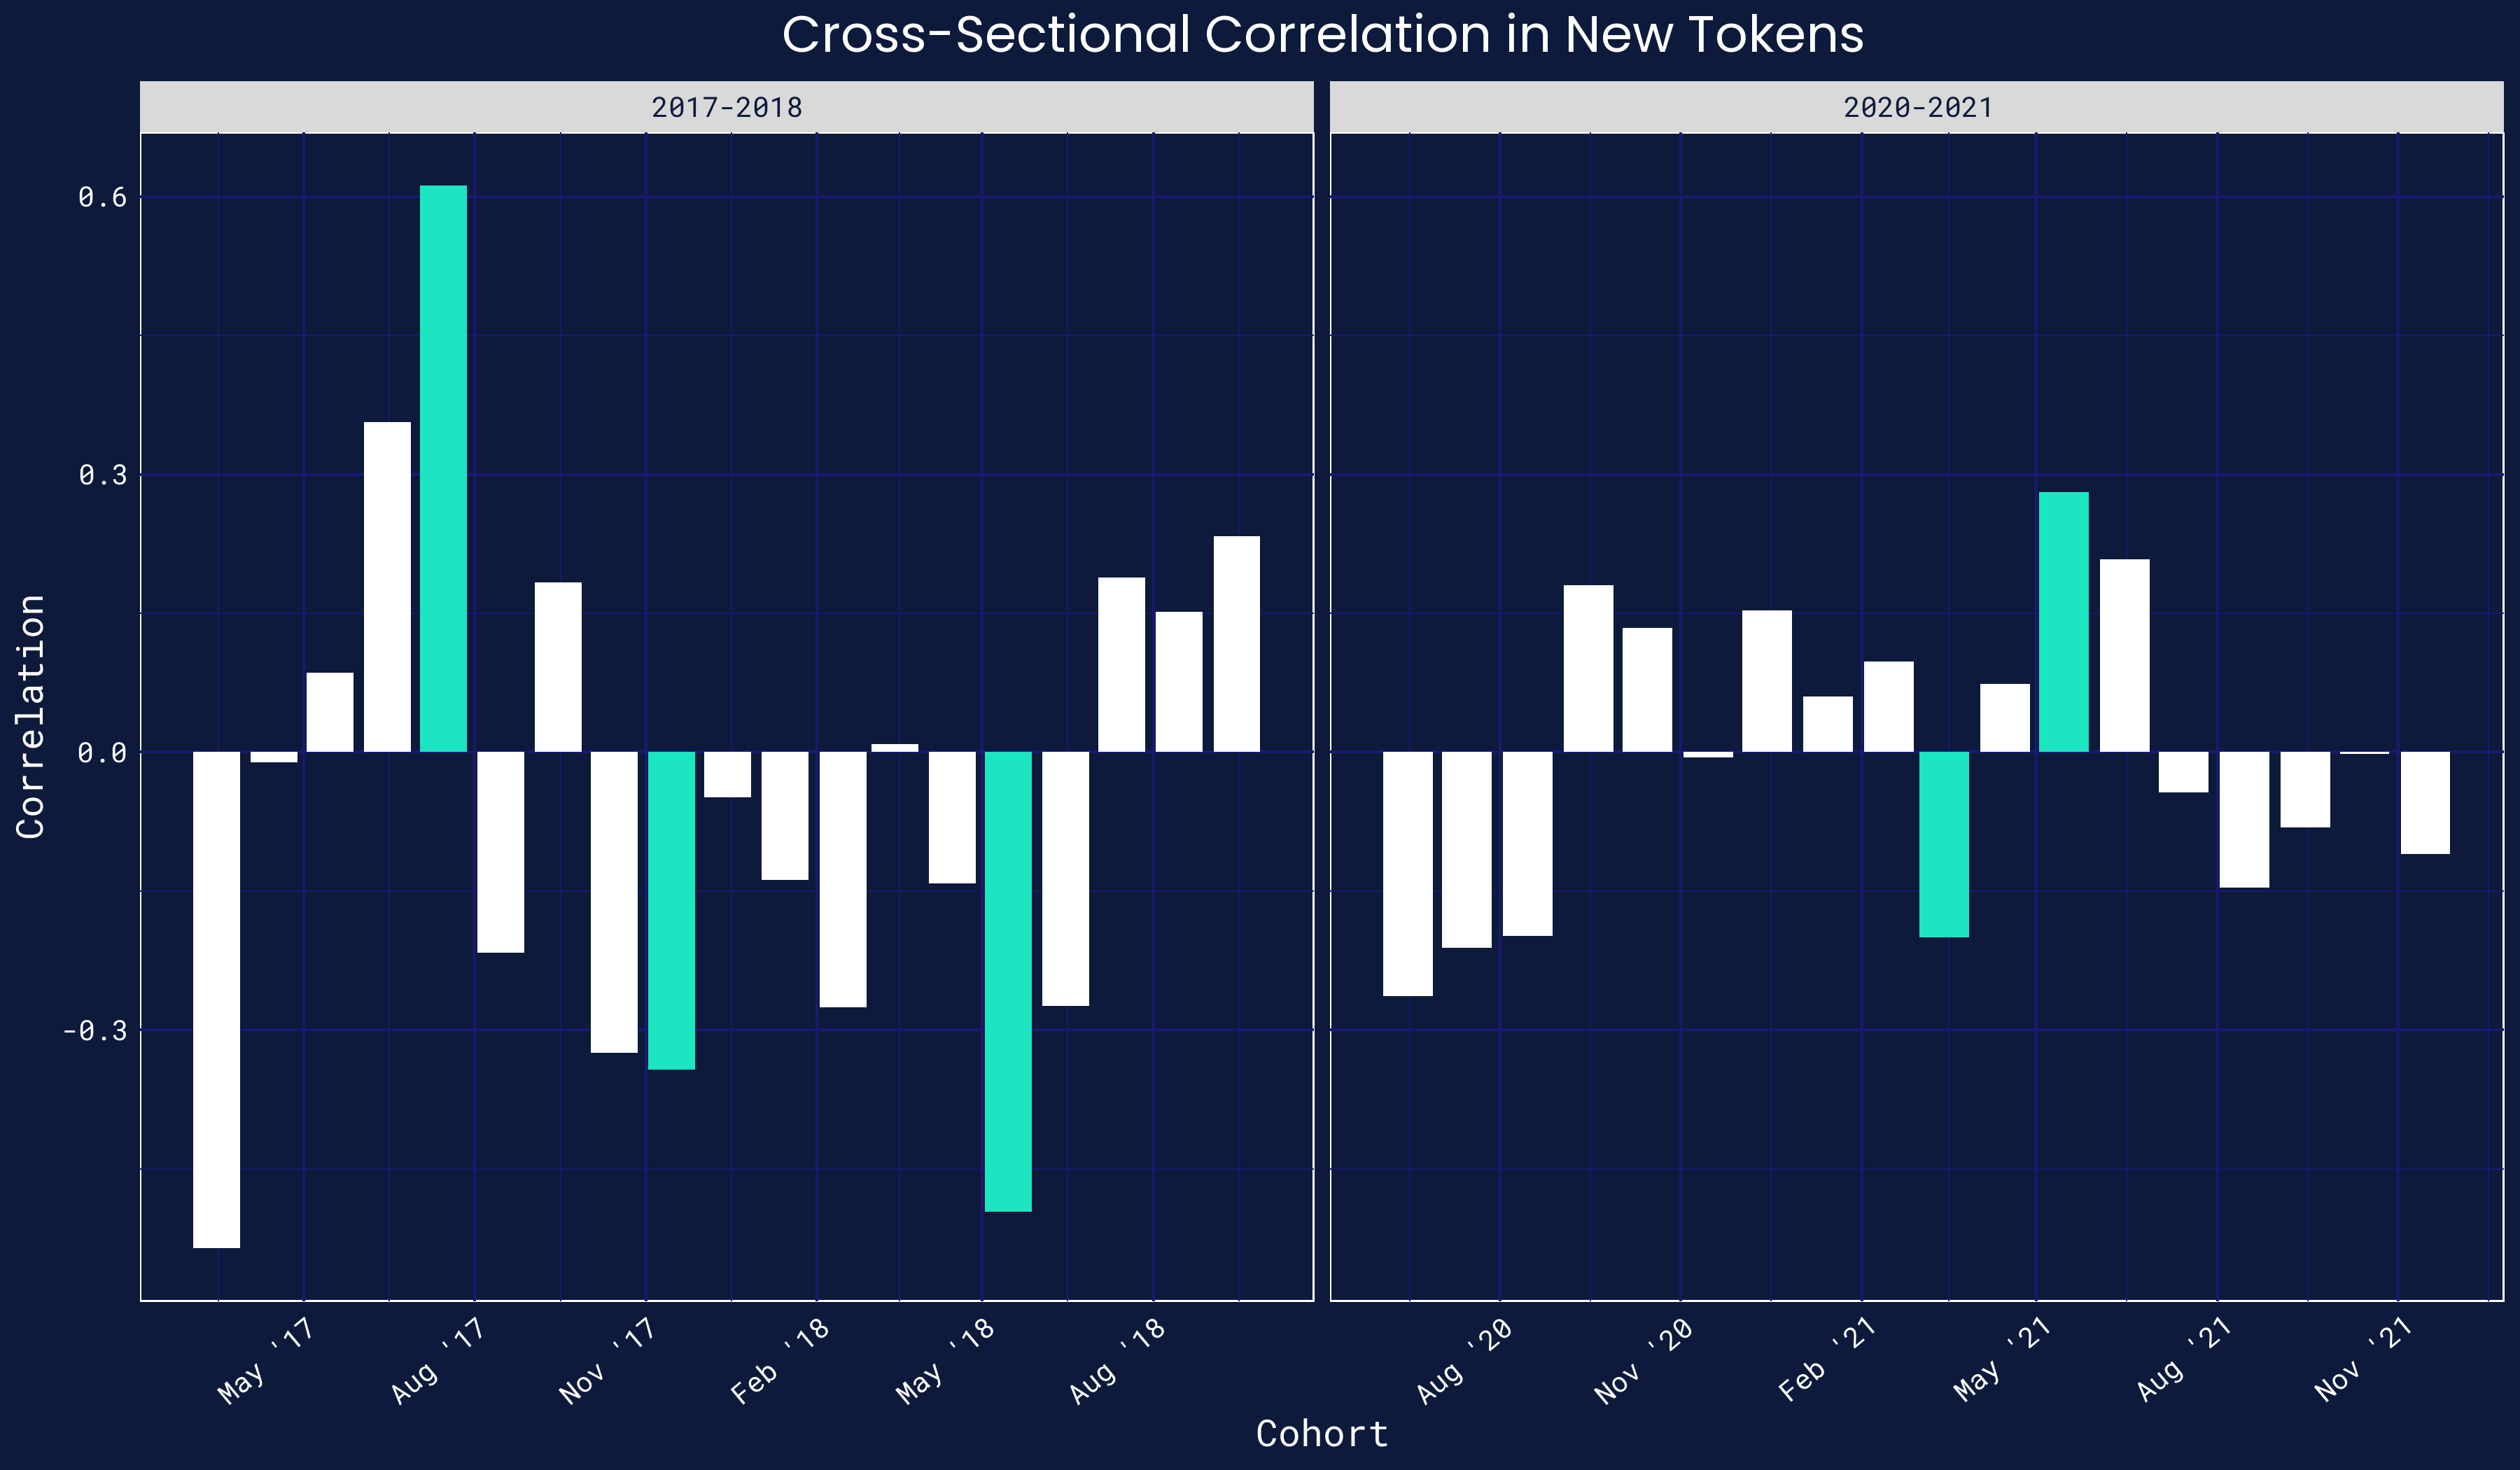
To test this, we continue to construct monthly cohorts. For each cohort, we measure the outlier-robust Spearman correlation between the cross-section of returns over their launch month and the cross-section of returns in the subsequent month. To focus on the main conclusion, we plot the correlations for the cohorts born over 2017-2018 and the cohorts born over 2020-2021. Both represent relative boom eras for crypto markets. Note that statistically-significant correlations are shaded teal.
Once again, the evidence shows there is little predictability. First, particularly in the more recent period, the absolute value of these correlations are small. Second, very few of these correlations are statistically significant (five of thirty-seven cohorts at the 5% level, which is only slightly better than random). Third, these correlations are neither systematically positive nor negative, which makes it difficult to extrapolate going forward.
Thus, once again, there is no obvious predictability. Sometimes a strong relative performance for a new token is followed by a weak one; sometimes by another strong one; and sometimes by nothing. The short price history of a token, even in relative terms, is not a reliable predictor of its future history — which points to a form of market efficiency.
Conclusion
As a grand theory, market efficiency can never be "proved." It can only be rejected by empirical facts. We do not doubt there will be some empirical fact that shows inefficiencies in the market for new tokens.
But we feel confident that those facts are not lying in plain sight. The various tests in this article largely show that new tokens historically have not systematically over-performed or under-performed the market, and their returns are not predictable on the basis of their environments or past performances. Crypto markets are not the underdeveloped sideshows that critics claim. Finding their flaws will take more digging.

Please let us know what we got wrong or what else you would like to see analyzed, as we would like to understand this subject matter thoroughly and correctly. Thanks to the research team at Jump Crypto and especially to Maher Latif and Shanav Mehta for feedback. This note does not constitute financial advice.
Disclaimer
The information on this website is provided for informational, educational, and entertainment purposes only. This information is not intended to be and does not constitute financial advice, investment advice, trading advice, or any other type of advice. You should not make any decision – financial, investment, trading or otherwise – based on any of the information presented here without undertaking your own due diligence and consulting with a financial adviser. Trading, including that of digital assets or cryptocurrency, has potential rewards as well as potential risks involved. Trading may not be suitable for all individuals.
- In academic circles, there are some standardized definitions and tests regarding "market efficiency." For instance, some papers test weak-form market efficiency, whereby prices reflect all previous price information, while others test stronger forms of market efficiency. Papers will also use methodologies such as the CAPM or the Fama-French-Carhart four-factor model to argue their conclusions. Given the broader audience of this article, we deliberately take a looser view and a broader approach to this question. ↩︎
- Coingecko has a free API that permits access to all tokens that it has ever tracked. Coinmarketcap’s API is not free for historical data, but it provides web access to all daily historical snapshots of the tokens it lists. While not entirely negligible, the bar for being tracked on Coingecko and Coinmarketcap is relatively low — namely, a price feed from any mid-sized centralized or decentralized exchange. (For instance, see this description by Coingecko, which primarily asks for a connection to any one of Coingecko’s partner exchanges — of which there are 542 as of the date of writing — in addition to simple steps like a working website.) As a quick sanity check, both trackers have many tokens with market capitalizations well below $1 million; and our analysis only examines tokens that cross at least $10 million in market capitalization. Finally, Coingecko has more permissive Terms of Use, so the figures and results we present in this blog are drawn from the Coingecko database — but all stylized facts are checked against the Coinmarketcap database. ↩︎
- This measure assumes that token holders do not earn returns in other ways on their positions, e.g. yield farming. Our general take is that yield farming represents risk-taking and enterprise-building (see an earlier blog post), and so those additional yields should not count as part of a passive buy-and-hold strategy. ↩︎
- There are alternatives, but they are worse. For instance, dollar-denominated returns would fail to control for general crypto sentiment. In turn, dollar-denominated returns that are also adjusted for Bitcoin’s dollar-denominated returns would solve this — but this makes the result harder to interpret. To illustrate the problems with both approaches, suppose we augment the original example such that one BTC costs $1 today and $4 tomorrow. The dollar-denominated return to token ABC would now be +100% — despite token ABC representing a bad trade for a retail crypto participant in qualitative terms. If we subtract out Bitcoin’s return in dollar-denominated terms, we instead arrive at -200% (as token ABC appreciated by 100% against the dollar, and Bitcoin appreciated by 300% against the dollar). While there is nothing mathematically wrong with a -200% return, returns below -100% are unintuitive. Finally, returns denominated in other cryptocurrencies, e.g. ETH, or a basket of cryptocurrencies would generate inconsistencies in the time series. Many new tokens predate the listing of those other potential reference benchmarks, forcing the time series to be defined with respect to changing bases. ↩︎
- We utilize logarithmic terms in the graph due to the strong non-normality of the data. Our formal tests address the non-normality by using Spearman correlations rather than Pearson correlations, which look at the relative ranks rather than raw values of data. ↩︎