

Overview
Note: Dates and times referenced in this article are in Greenwich Mean Time (GMT).
Over the three days from May 7 through May 9, Terra’s UST stablecoin deviated from its $1 peg in a sudden turn of events. After reviewing the publicly available transaction and exchange data, the research team at Jump Crypto has three key observations.
- The episode was triggered by a particular sequence of trades in the UST/3CRV Curve pool on Saturday, May 7.
- The Anchor outflows from Saturday, May 7 until Monday, May 9 — in particular, from a small set of large traders — put substantial pressure on the UST peg.
- The strong crypto market selloff on Monday, May 9 added additional pressure, which finally pushed UST materially off the peg.
This article is not an exhaustive study of these events, but we hope this information is helpful to those who are analyzing this course of events.
Background
As a short recap of the timeline of UST over this episode, the three days elapsed as follows:
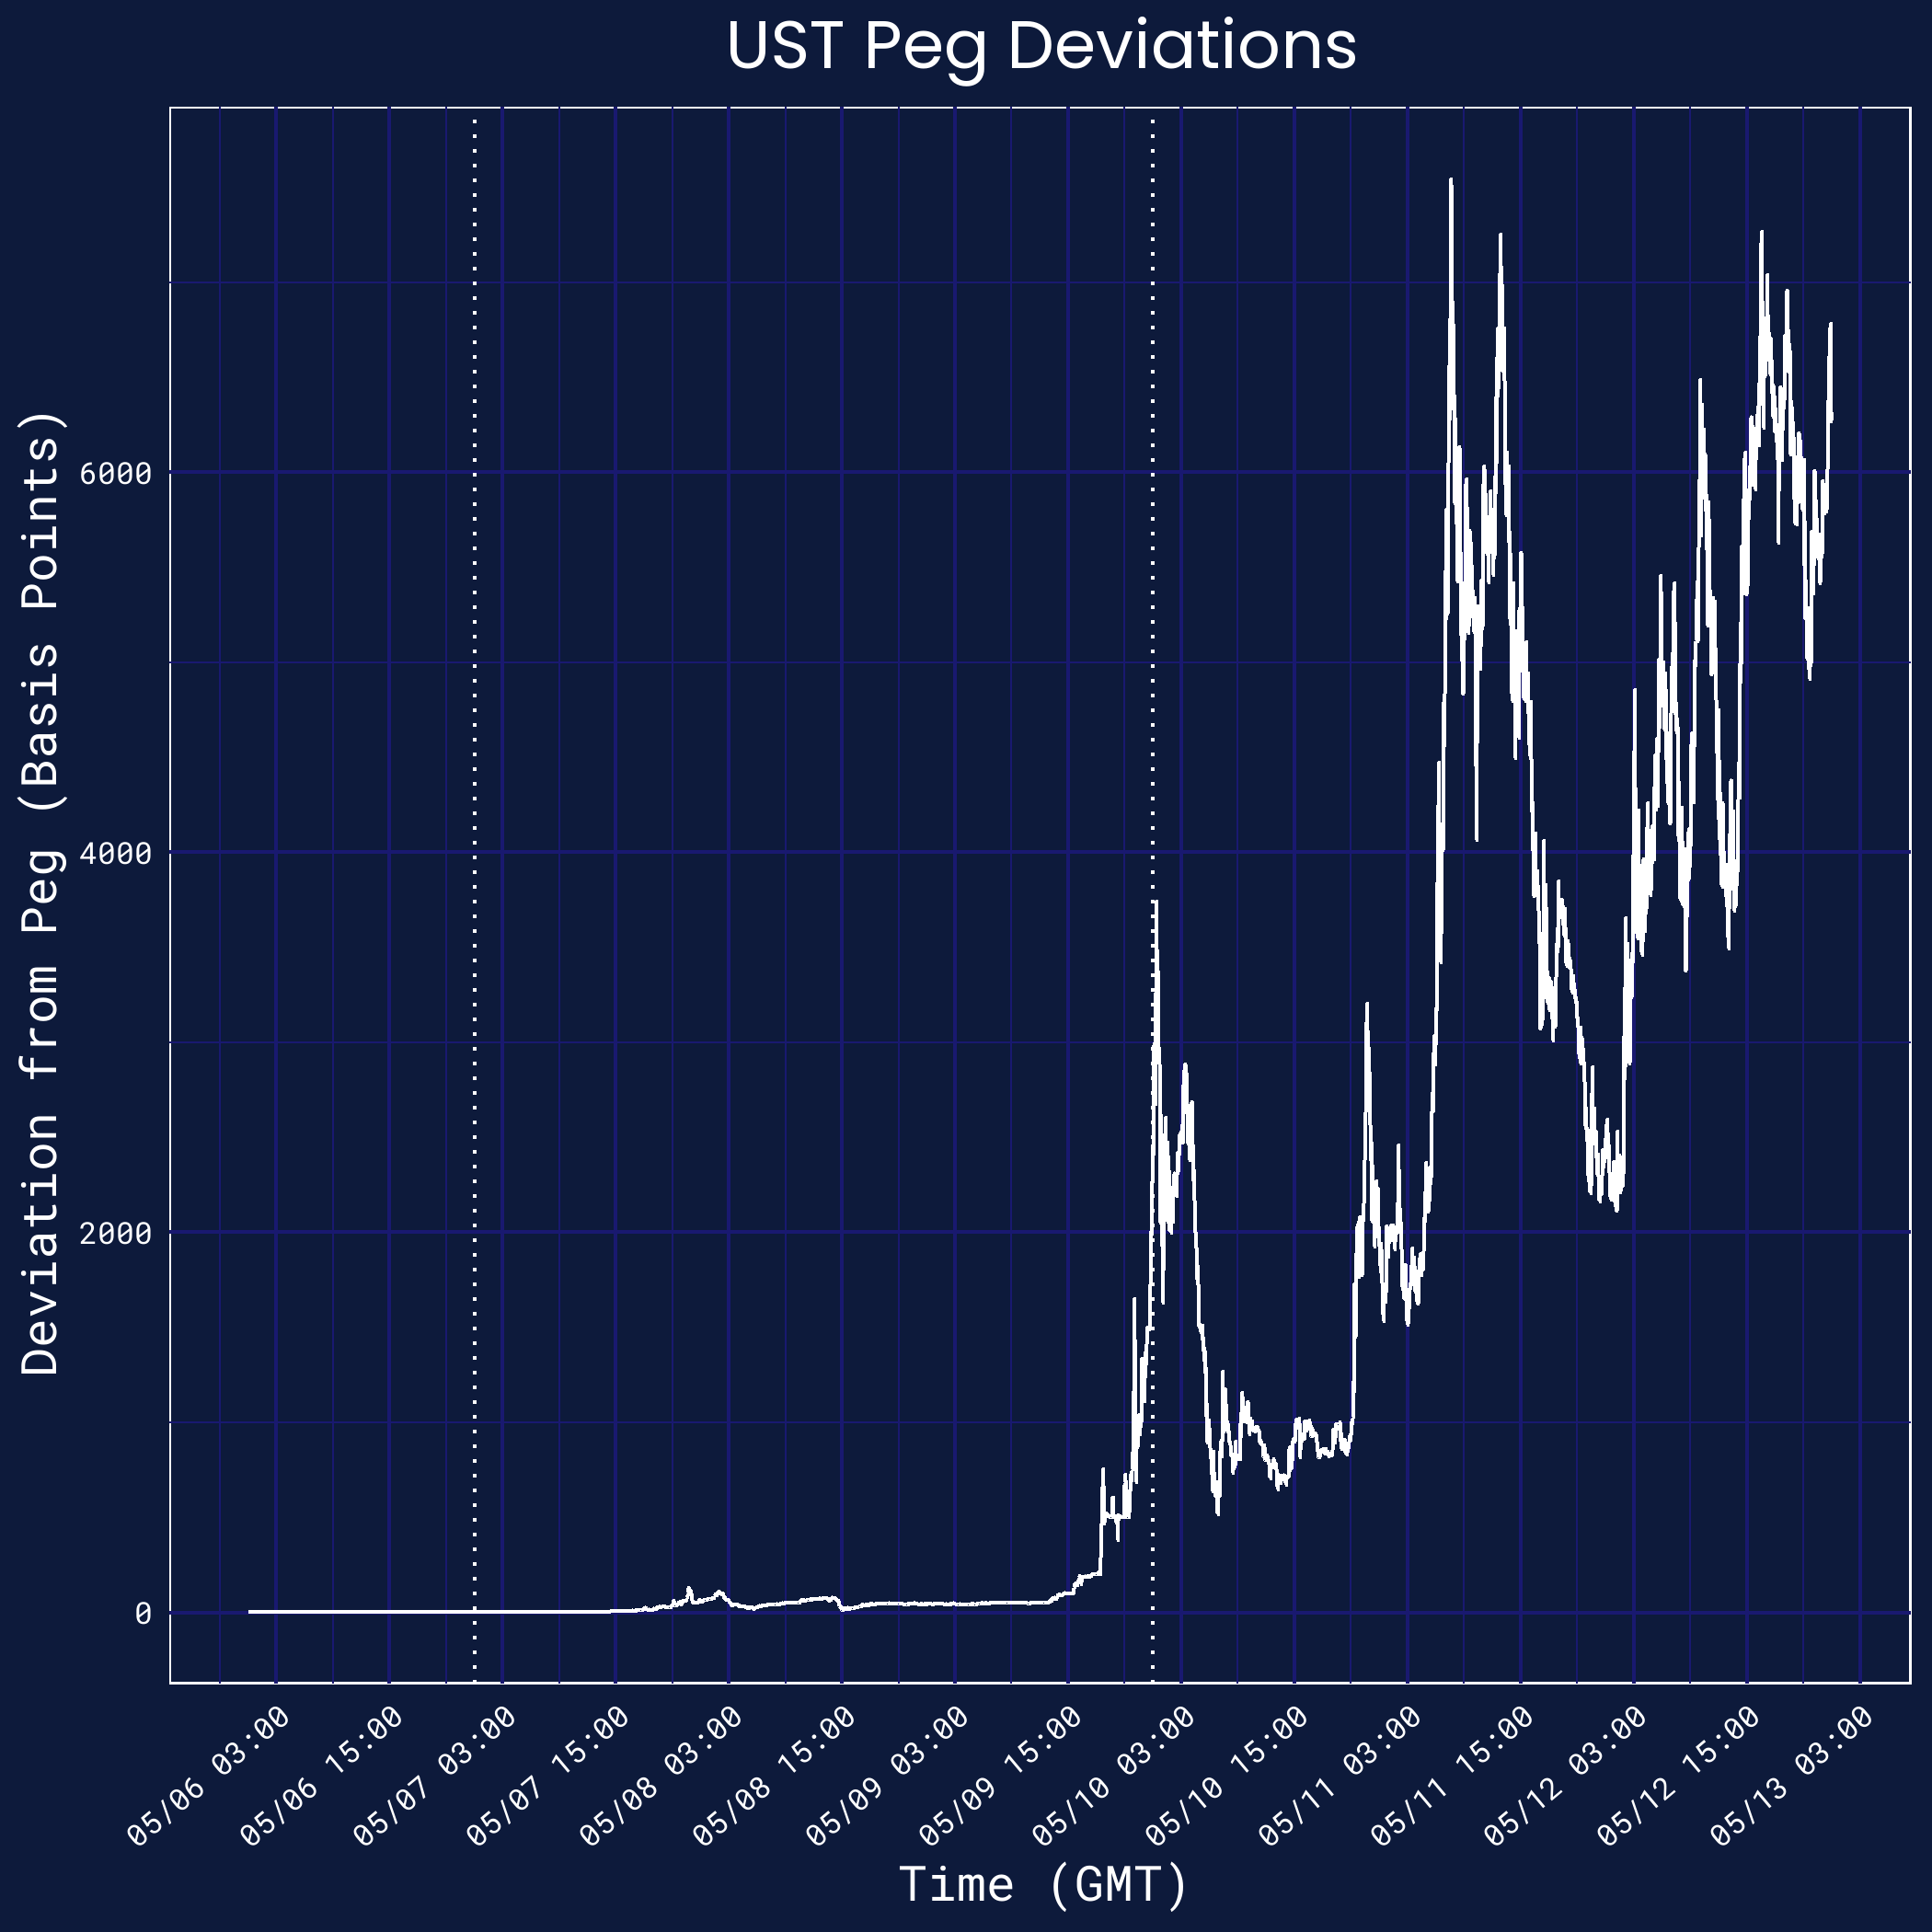
- Saturday, May 7 — UST first deviates from its peg. It deviates by as much as 130 basis points at one point, and ends 60 basis points away from its peg.
- Sunday, May 8 — UST faces pressure all day, but largely stays within 100 basis points of its peg.
- Monday, May 9 — UST comes off its peg materially around 18:30 GMT, ending the day at almost 25% (2450 basis points) away from its peg. For the next three days, UST’s price fluctuates between $0.95 and $0.25.[1]
We show a seven-day history of UST’s price below, with markers to indicate the start and end of these three critical days.[2]
This section provides a quick primer on Terra’s UST and LUNA for readers unfamiliar with the topic. Terra relied on a dual token system. UST was the algorithmic stablecoin pegged to $1, while LUNA served as its supporting seigniorage asset, aiming to absorb the volatility that otherwise would be experienced by the stablecoin.
UST was designed to maintain its peg through the on-chain mint and burn mechanism, a virtual automatic market maker (vAMM) rooted in the condition that 1 UST, irrespective of its market value, is worth approximately $1 of LUNA. This mechanism was constructed so that volatility and UST price dislocations could be smoothed out with UST and LUNA supply expansions or contractions via on-chain arbitrageurs.
- If UST’s market value was well above peg, say $1.10, an arbitrageur could purchase $1.00 worth of LUNA and swap into UST via the on-chain mechanism — providing the $1.00 of LUNA in exchange for one newly minted UST, worth $1.10. The arbitrageur would then sell the UST on the market and pocket the difference between the UST market value and the on-chain mechanism’s value. This operation would expand the supply of UST and, if repeated enough times, would reach a point where the expanded supply of UST roughly equated its demand at approximately $1.00.
- In the inverse scenario where UST’s market value was below peg, say $0.90, an arbitrageur could purchase the discounted UST and swap into LUNA via the on-chain mechanism. The 1 UST, worth $0.90, would be exchanged for $1.00 worth of LUNA. The arbitrageur once again would pocket the difference between the market value and the on-chain mechanism’s value of UST and critically play a role in contracting UST’s supply until it reaches its peg.
UST underpinned many of the protocols throughout the Terra ecosystem. However, its most common use case was Anchor, a popular lending and borrowing protocol that provided depositors with high fixed interest rates. At its peak (just prior to May 7), the UST deposited into Anchor accounted for nearly 75% of the total UST market capitalization.[3]
May 7: Curve Pools
Overview
- Liquidity conditions gradually worsened over Saturday, May 7, particularly on Curve.
- During a seventy-five minute span on Saturday, May 7, a series of critical transactions first pushed UST off the peg.
- At 21:44 GMT, Terraform Labs (TFL) withdrew $150 million in UST liquidity. This made the Curve pool relatively balanced, but much smaller.
- At 21:57, a relatively-inactive account ("Wallet A") swapped $85 million UST for USDC in this pool. (This was the largest swap transaction in that particular Curve pool ever.) Such an action pushed the Curve pool out of balance again.
- From 22:32 - 22:38, another account ("Wallet B") swapped $75 million UST in the pool across three transactions. By this point, the pool was severely imbalanced.
- At 22:52, Terraform Labs withdrew another $100 million in UST liquidity. This made the pool slightly more balanced, but it was still heavily imbalanced and — more critically — tiny at this point, leaving it vulnerable to even small transactions.
- At 22:59, Wallet B swapped another $25 million UST in the pool.
- After 23:00, there was a flurry of activity in the Curve pool. Appendix A.1 briefly explores those transactions, but an excellent research note recently published by Nansen.ai should be consulted for more depth on both those and other transactions.
- Moreover, Wallet A had transferred $108 million in UST to Binance earlier in the day — and these transfers coincided with elevated trading volumes at Binance and the worsening liquidity at Curve.
Note: Links to all of these on-chain transactions are provided in Appendix A.1.
Liquidity Conditions over May 7
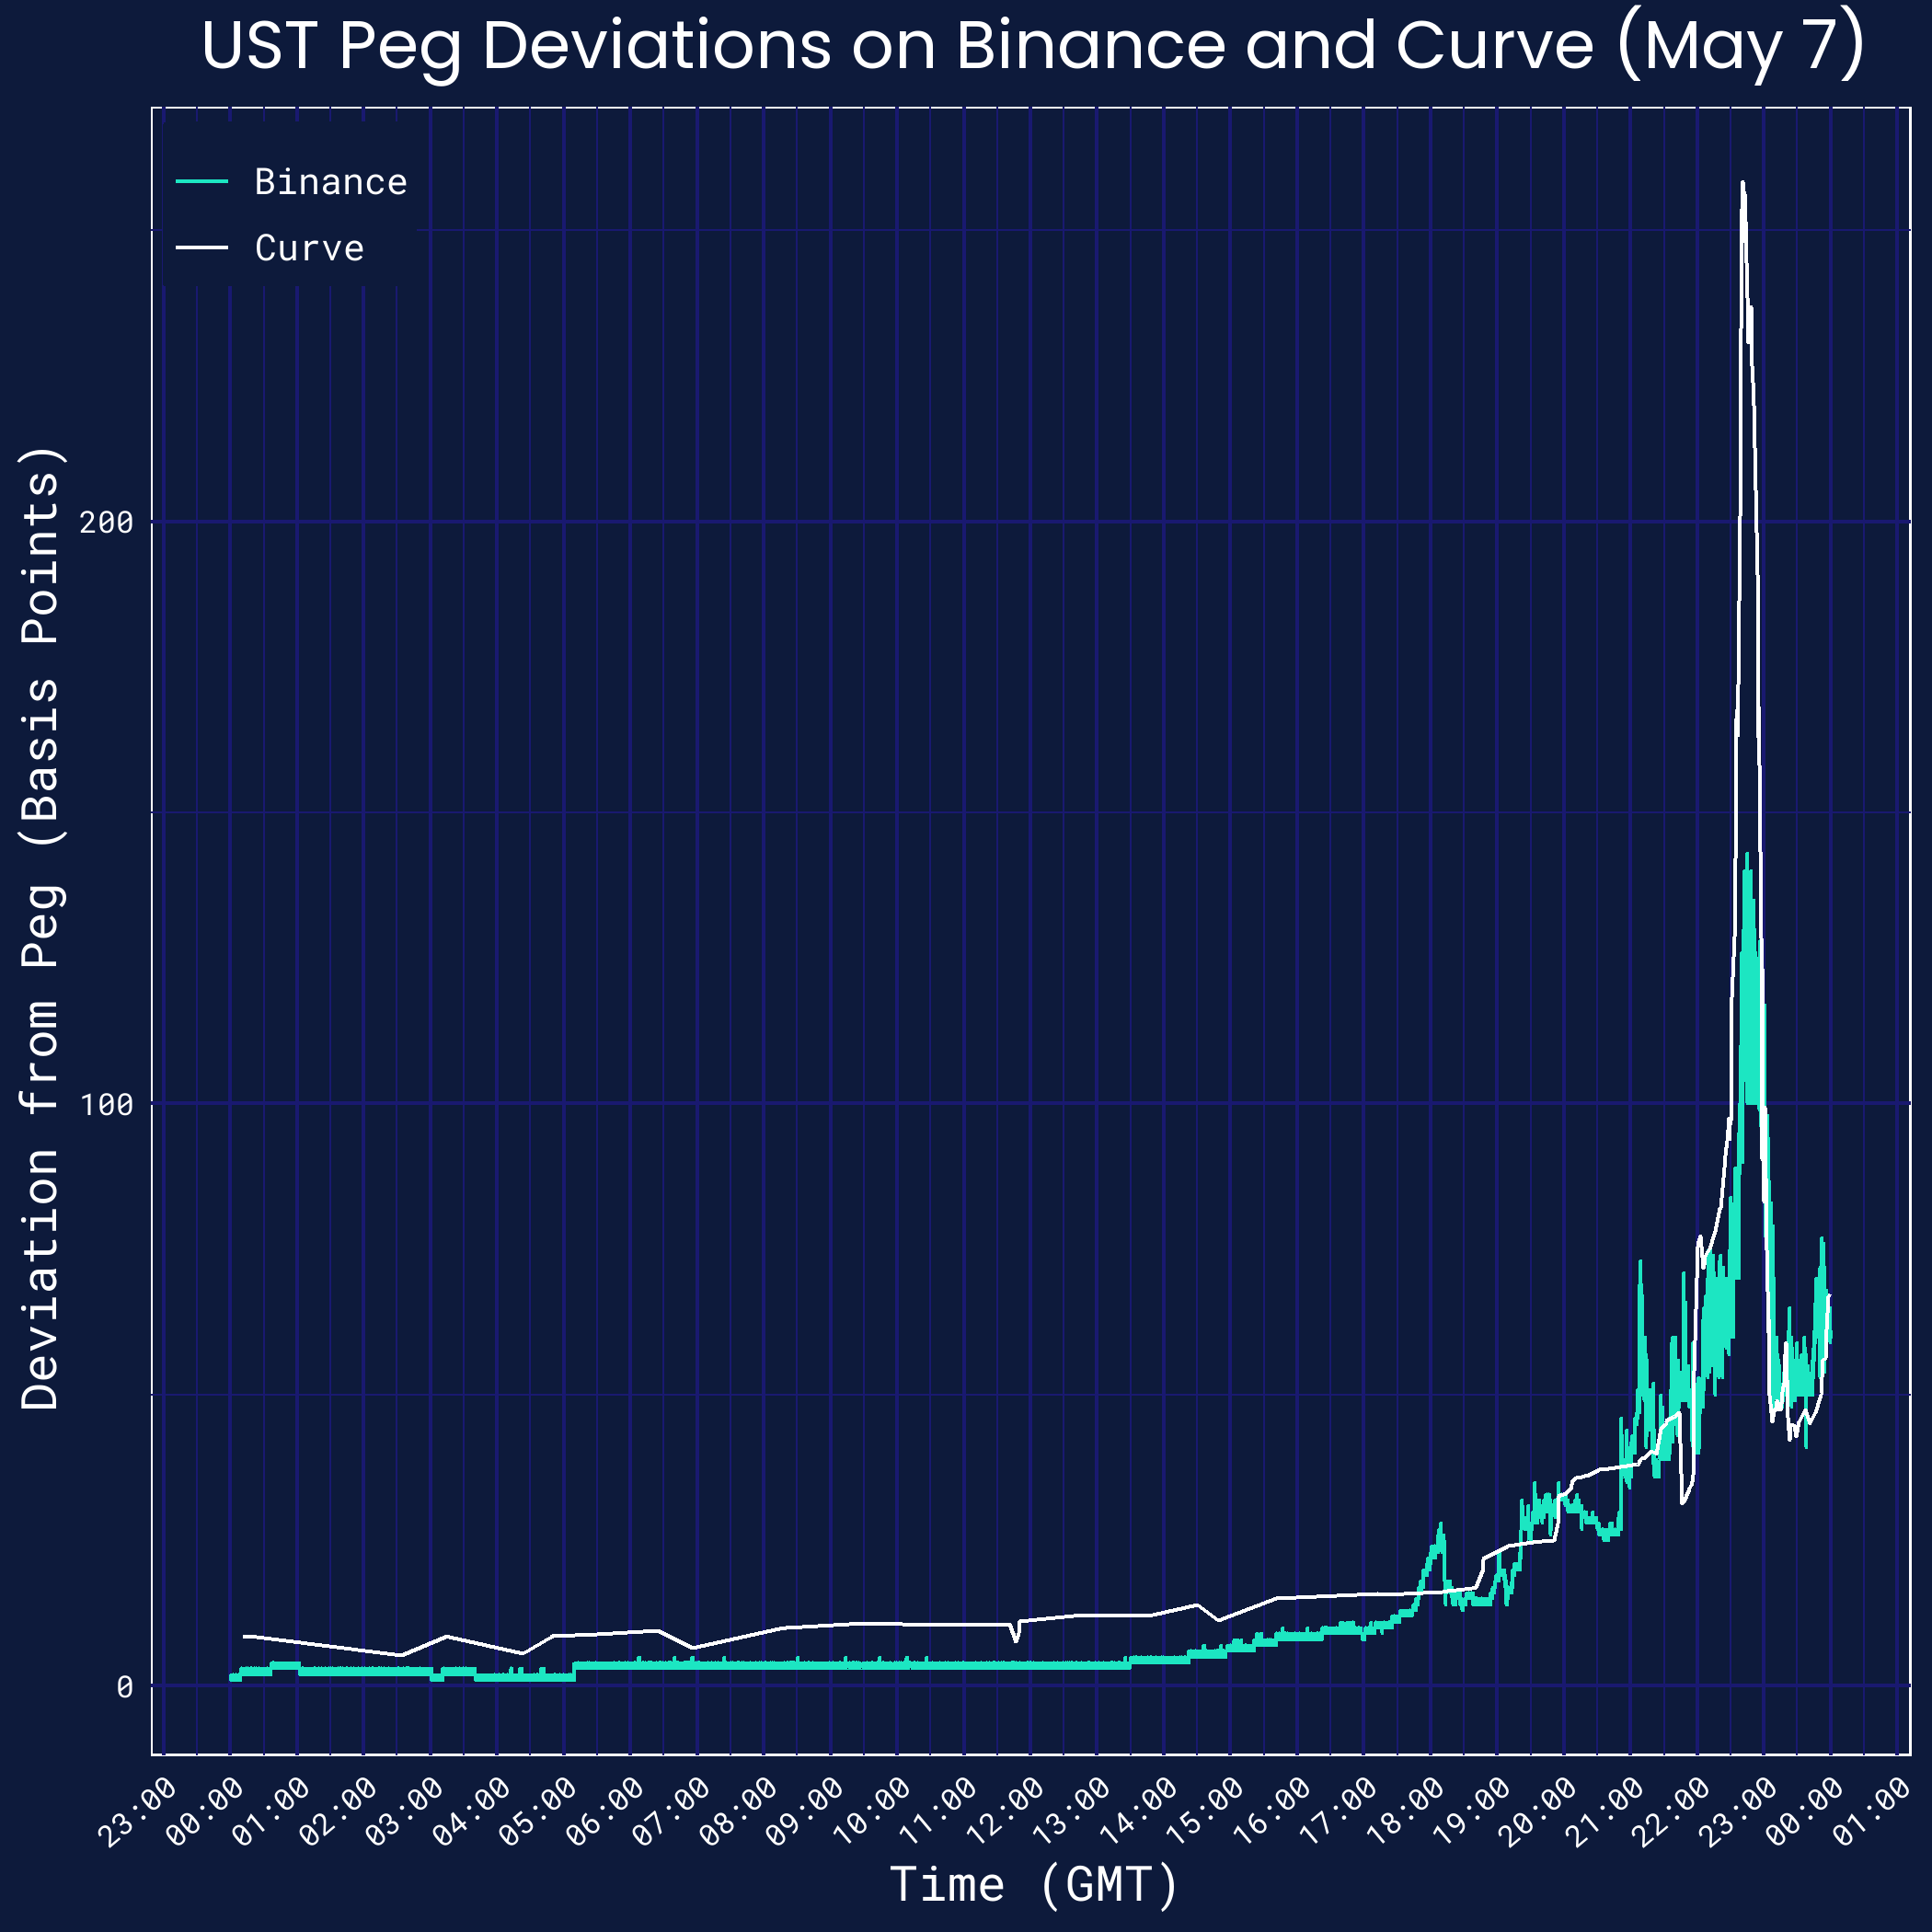
Saturday, May 7 was a critical day for the UST peg. The graph below charts the minute-by-minute price of UST on that day, as measured on both Binance and Curve. We rely extensively upon the UST/USDT market in Binance throughout this piece, which was the most liquid market for UST on any centralized exchange during this period; and on the wormhole-UST/3CRV market on Curve, which was the most liquid market for UST on any decentralized exchange during this period. (A short description of Curve pools is in the footnotes.[4])
This graph shows that most of the day elapsed with a stable peg — until 15:00 GMT, when UST started to deviate from the peg.[5][6]
We can further examine this trend by looking at the relative Curve pool sizes in the graph below.[7] This shows a gradual worsening in the imbalance throughout the day, with a sudden acceleration after 18:00 GMT.
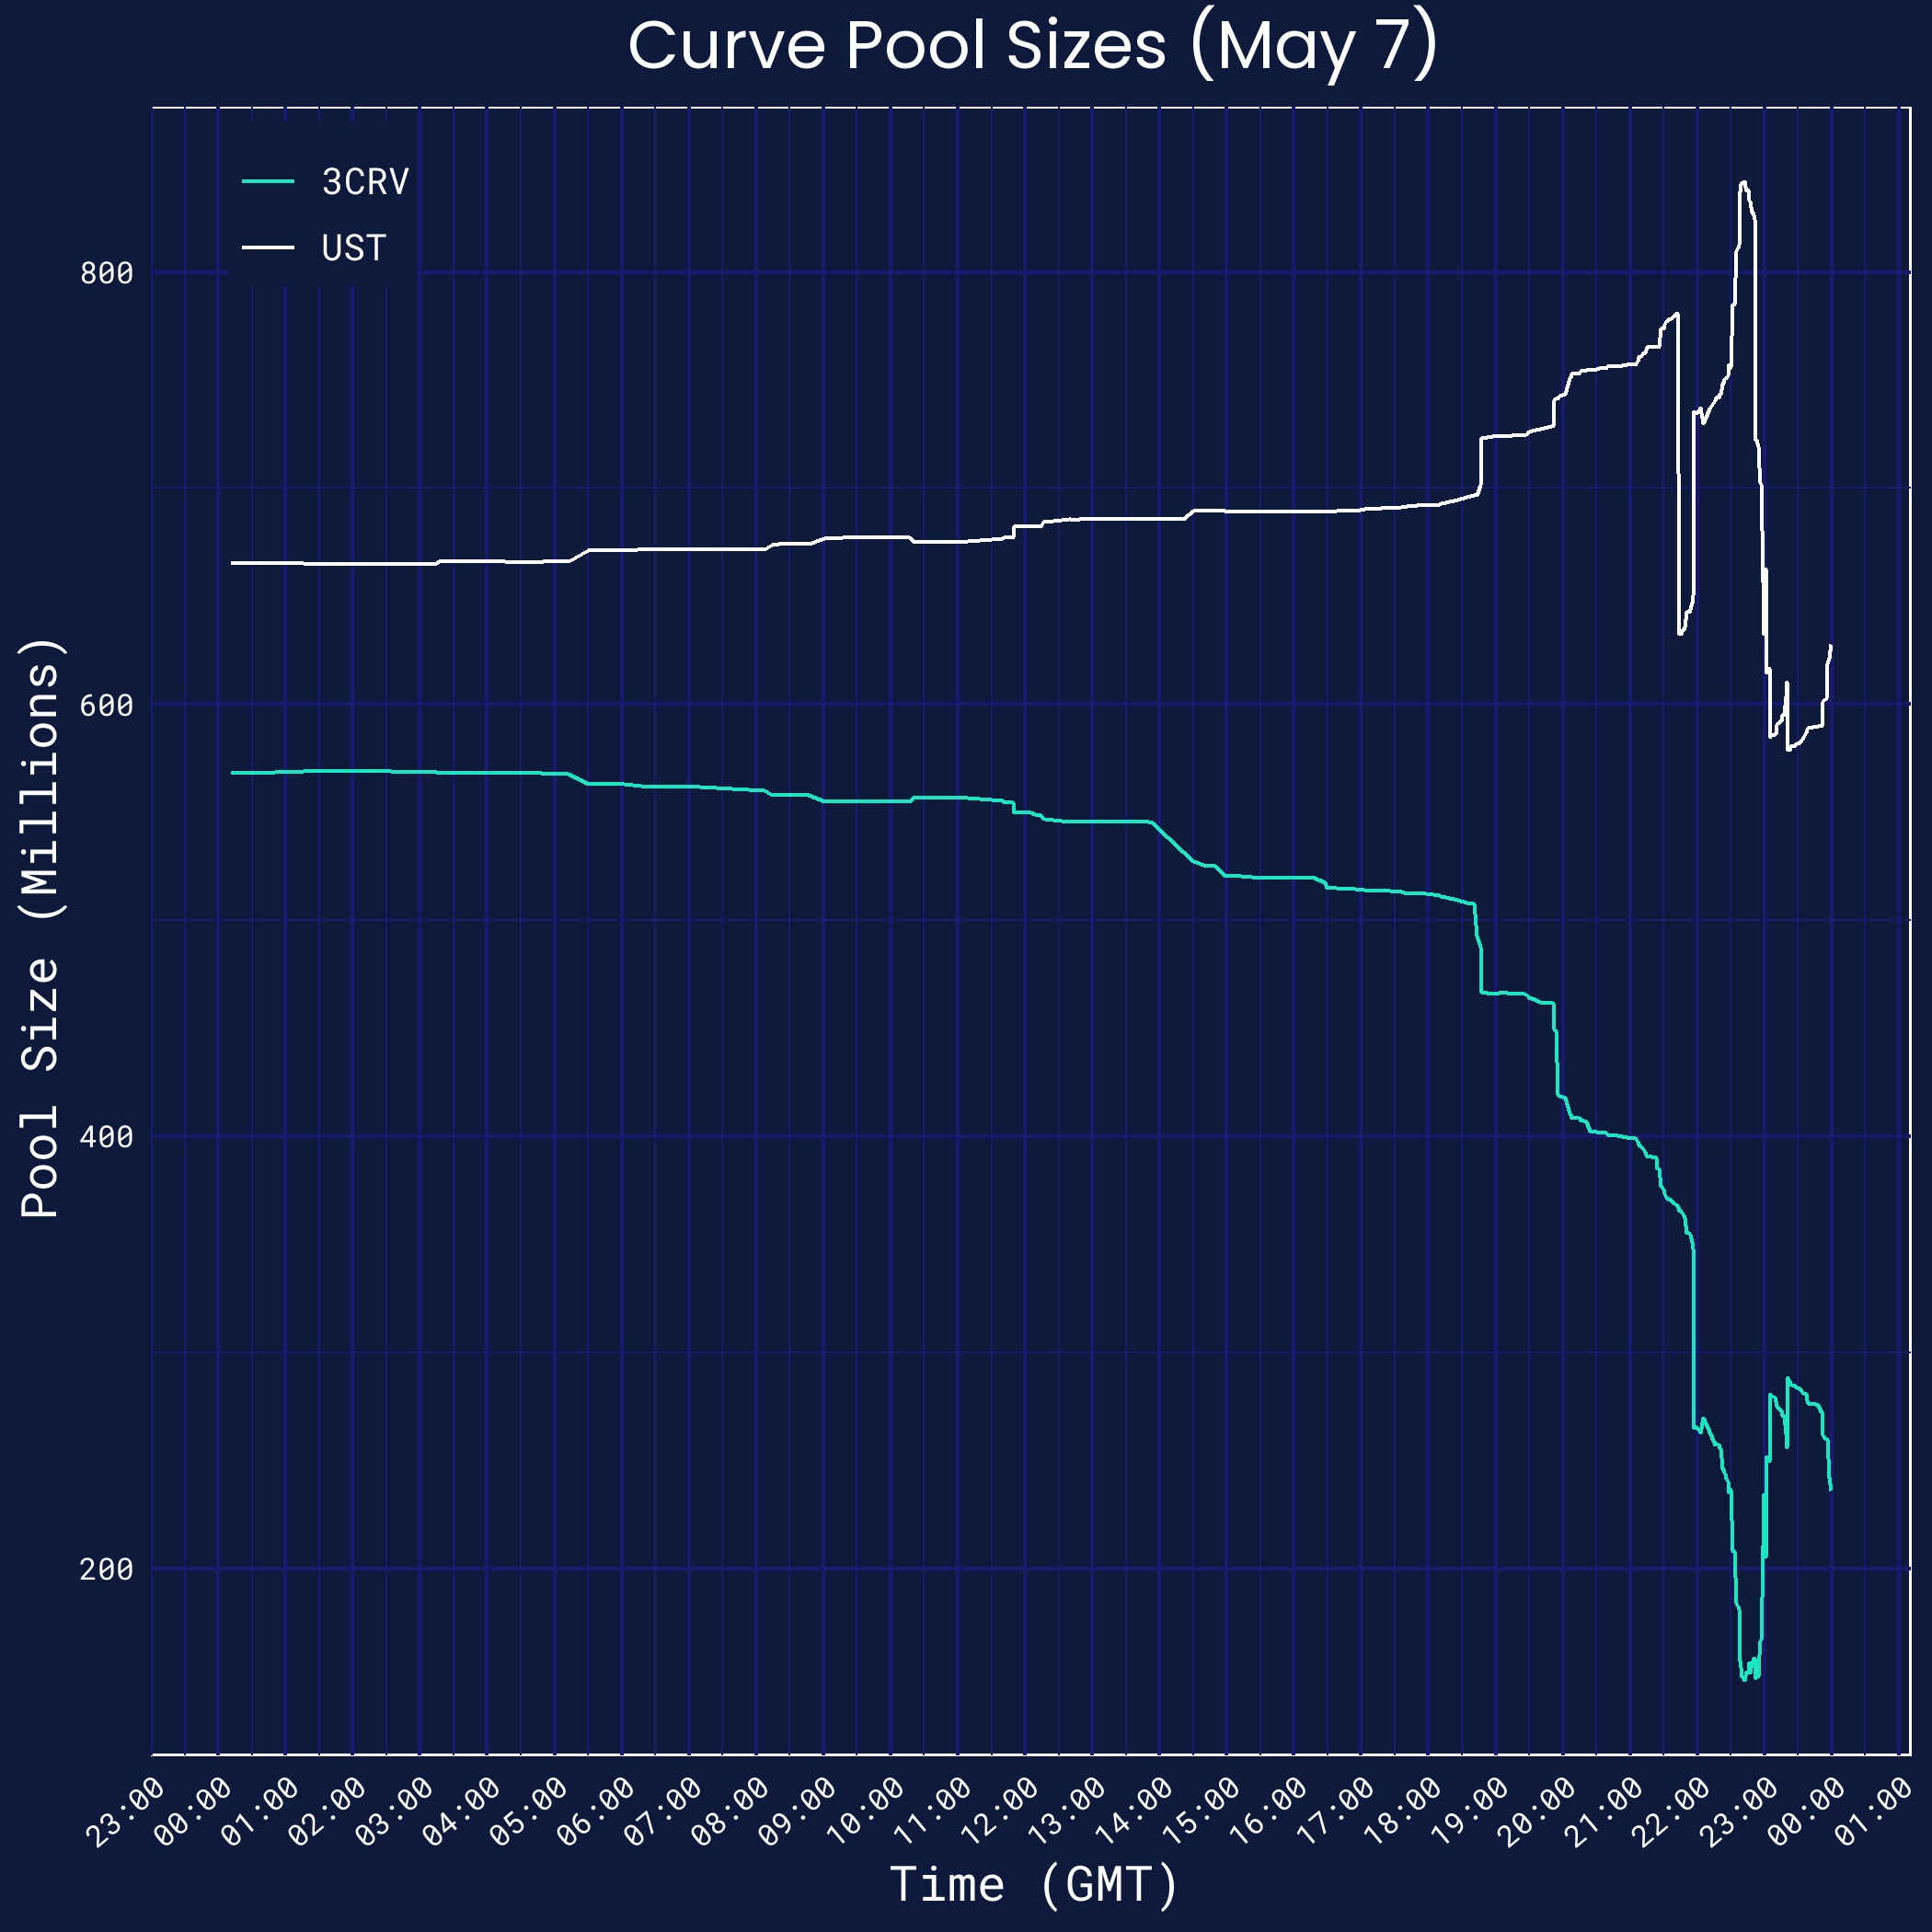
Several large trades in the Curve pool occurred over this interval — and in Appendix A.1, we provide additional detail on these and other transactions. Here we focus on the trades between 21:44 and 22:59 in particular, as those were the most critical ones. Appendix A.1 notes that the remaining large trades certainly made the event worse, but they were not otherwise noteworthy in terms of their sizing or timing.
The Critical Hour of May 7
Following a critical seventy-five minute period on May 7, UST came off its peg in the Curve pools. The timeline of this period is noted below, with all transactions linked to Etherscan. Thus far, we have not been able confirm the identity of the owner(s) of any of the wallets in the table below or Appendix A.1, other than the TFL wallet.
Ethereum BlockTime (GMT)Transaction HashActorTrade Size (UST)Method1473223521:44HashTFL$150MMWithdraw1473228721:57HashWallet A$85MMSwap1473244722:32HashWallet B$25MMSwap1473245922:35HashWallet B$25MMSwap1473247622:38HashWallet B$25MMSwap1473254722:52HashTFL$100MMWithdraw1473258122:59HashWallet B$25MMSwap
We show this graphically below, where each dotted line corresponds to each row in the table above in sequence.[8] As a reminder, UST Swaps caused the UST balance to rise and the 3CRV balance to fall; and UST withdrawals caused the UST balance to fall without any change in the 3CRV balance. The former made the pool imbalanced, while the latter improved balance but made the pool shallower.
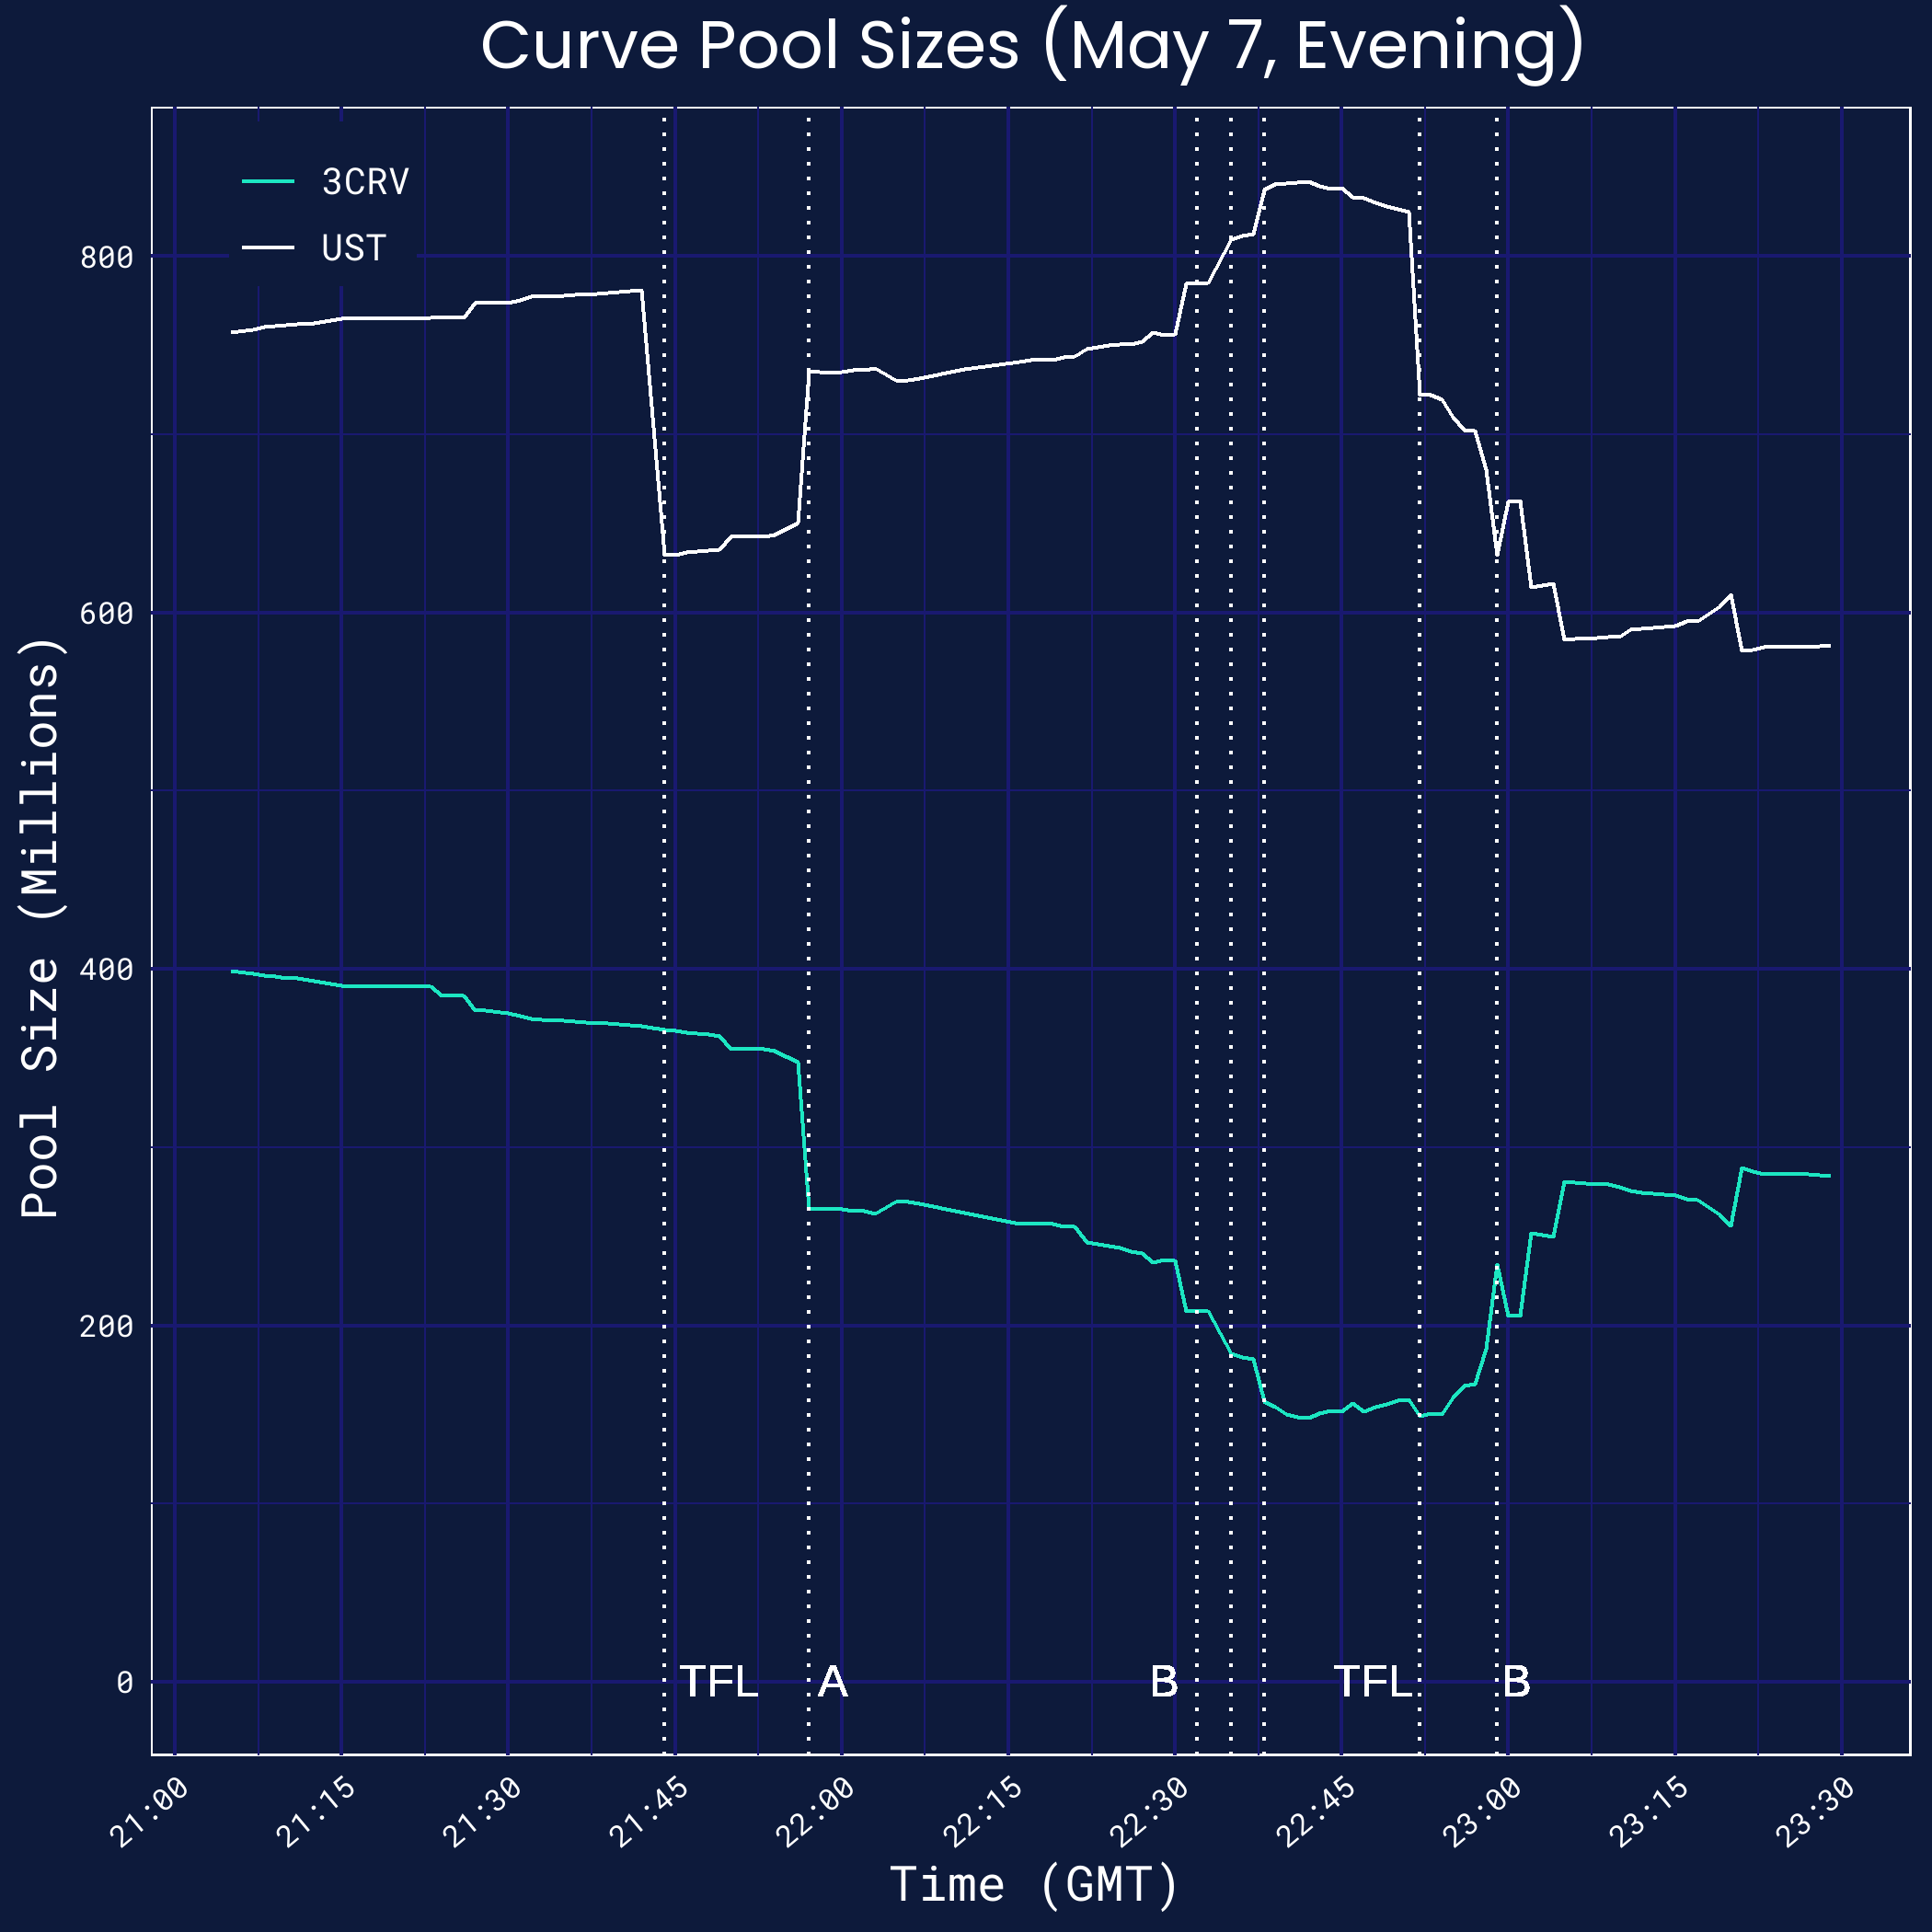
This period proved costly for UST in both direct and indirect ways. In direct terms, UST had deviated from the peg by over 100 basis points on Binance and over 200 basis points on Curve through this period.[9][10] In indirect terms, by deviating from the peg, UST likely attracted more attention and more concerns about its stability — as we explore in later sections.
Wallet A's Actions
While the Curve pool illustrates the most noteworthy sequence of events on Saturday, May 7, there remain open questions around the worsening liquidity earlier in the day. On further examination, this coincided with some other transfers from Wallet A.
In particular, from 5:00 to 21:40 GMT, Wallet A had sent $108 million in UST to Binance in clips of $10 - 20 million (example hashes here and here). This is the largest set of UST transfers to Binance by that point in the day, by far — dwarfing second-place at $37 million.[11] Moreover, if those positions were indeed liquidated in the UST/USDT market that day, this notional would account for a third of the total volume done by that point in the day.[12]
Moreover, the worsening liquidity on Curve coincided with high volumes at Binance. The graph below plots UST/USDT cumulative volumes on Binance (in blue) against the imbalance between UST and 3CRV on Curve (in black).[13][14] There is a sharp uptick in volumes at Binance after 15:00 GMT, and that aligns with the relative imbalance at Curve.
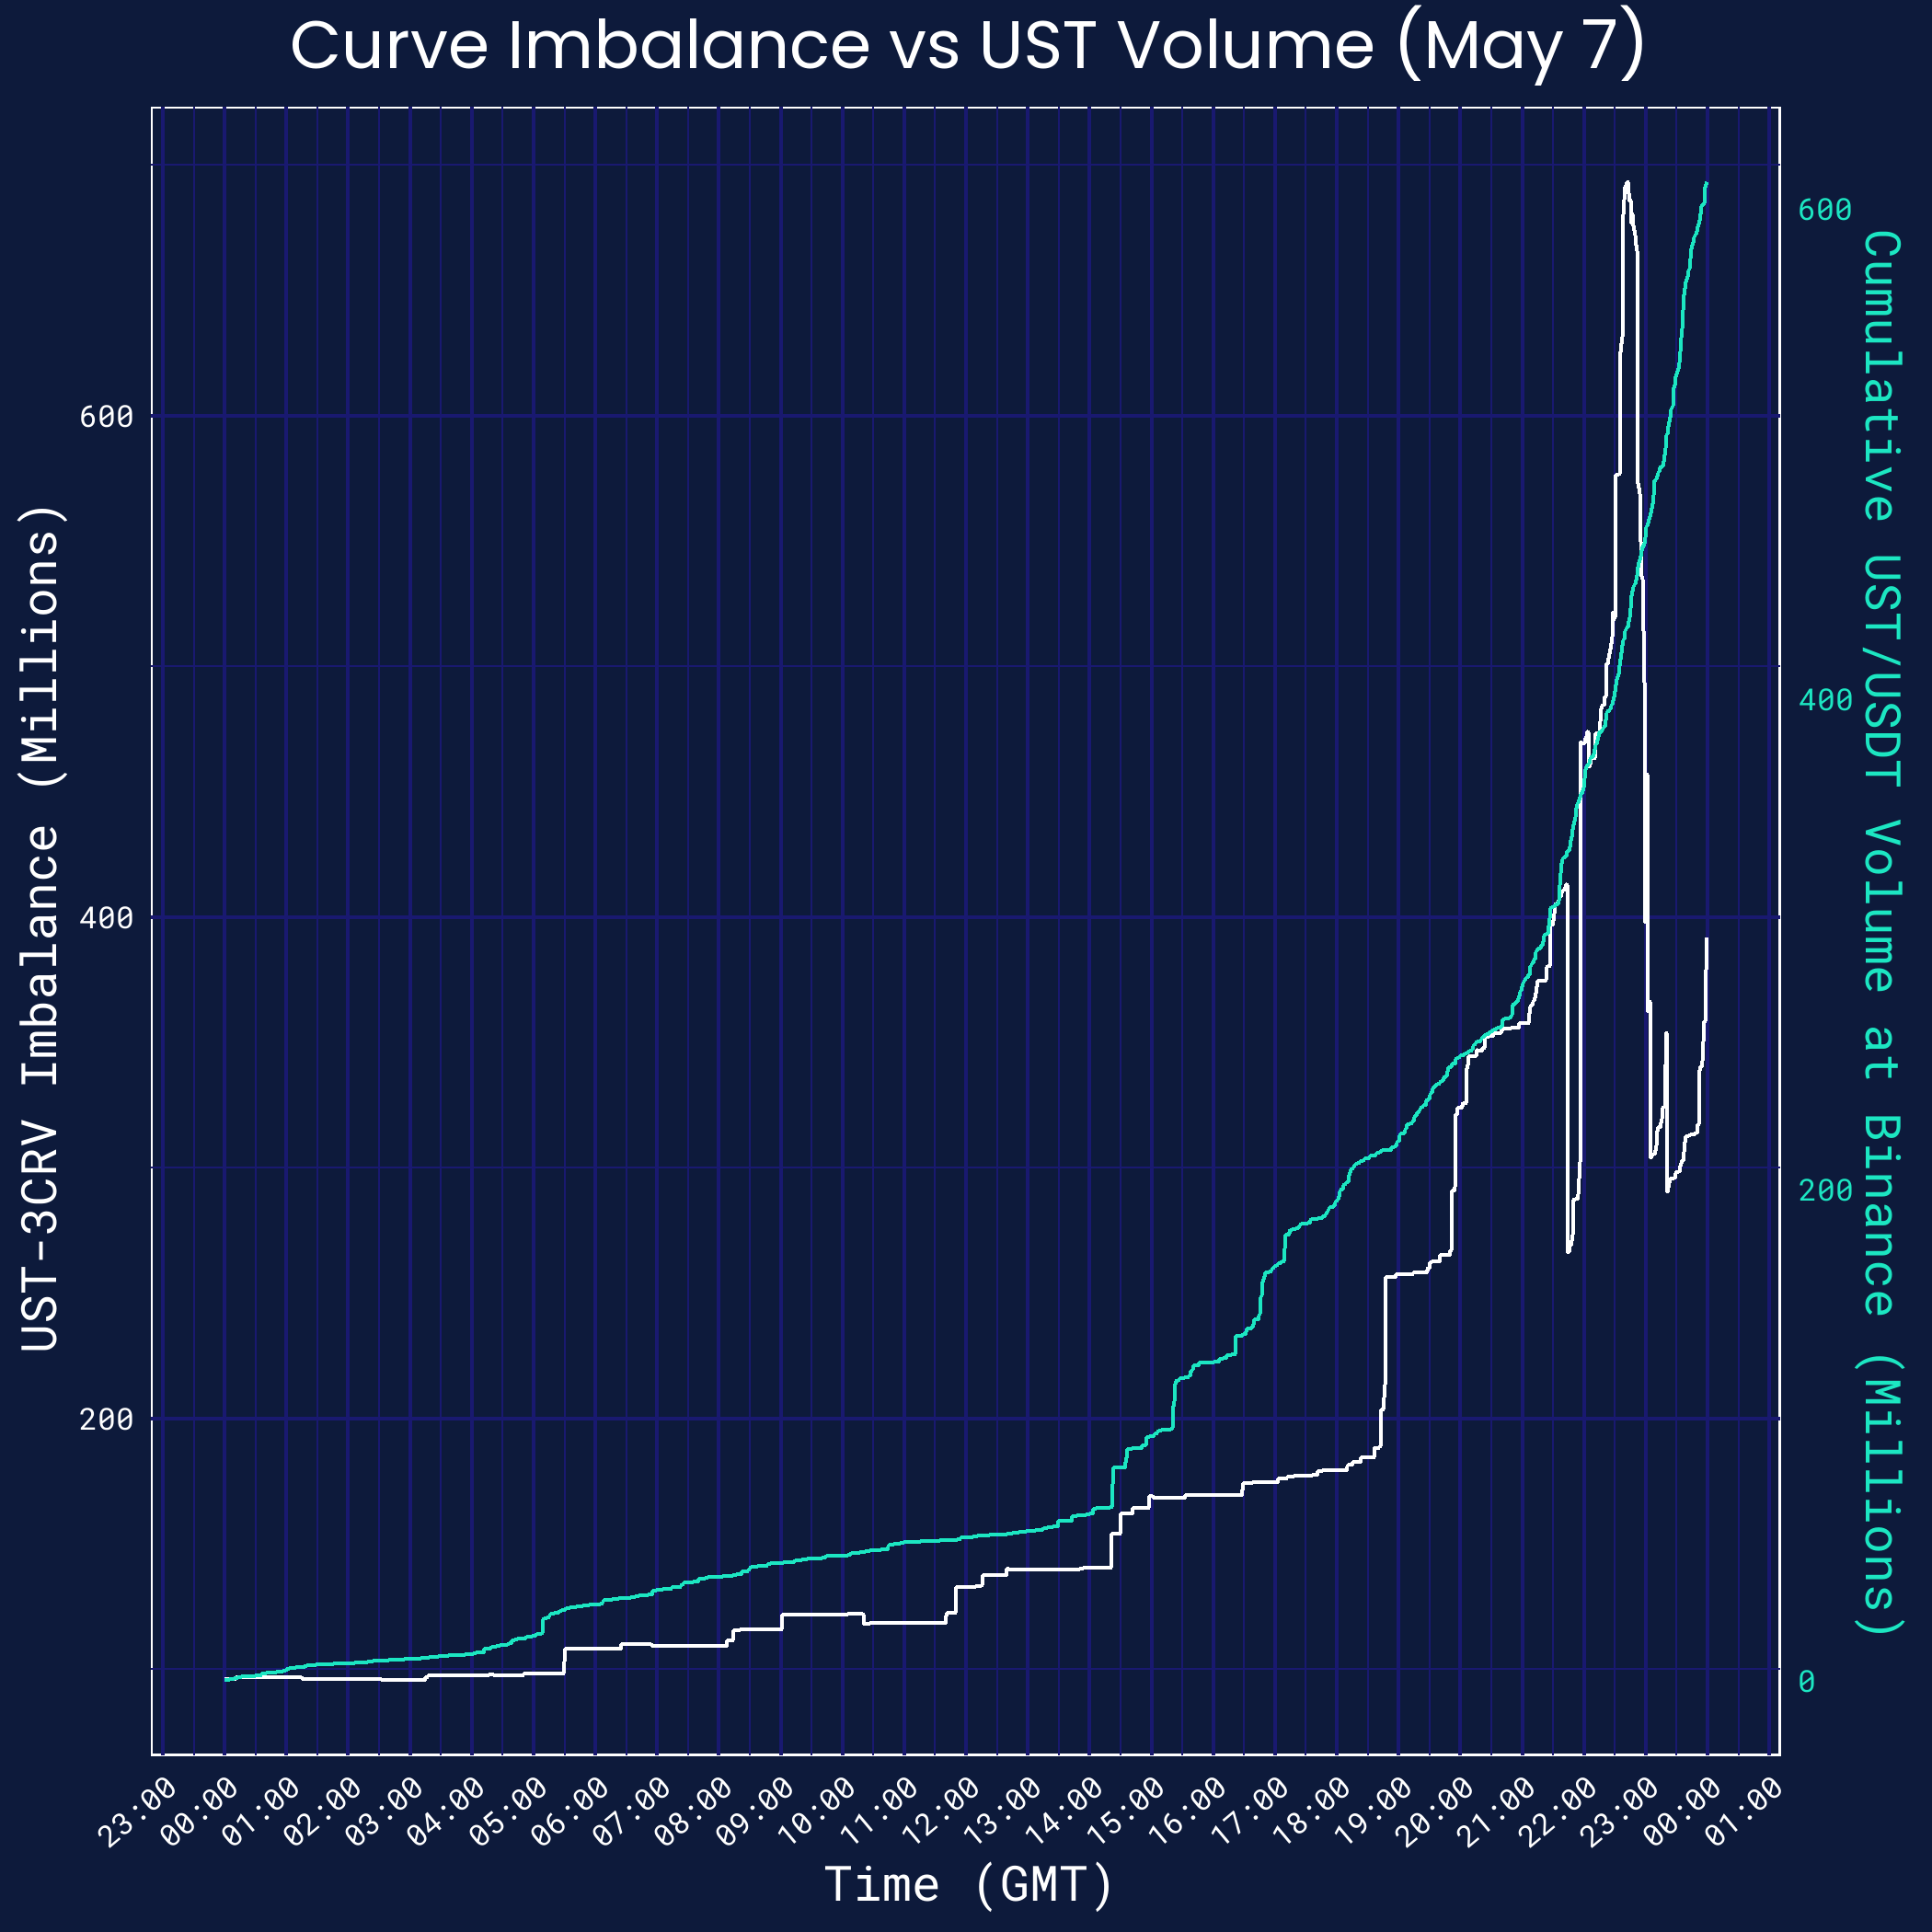
Thus, one hypothesis to link these facts is that Wallet A sold UST on Binance, and that relatively one-sided selling pressure manifested in worsened liquidity for future UST sales on both Binance and Curve. We do not have any visibility into the transactions at Binance, so we can neither validate nor reject this hypothesis with certainty.
We do not know who controls Wallet A. They traded in large size, but their activity differs from what would be expected from an active or sophisticated trading operation. We thus provide some additional facts to supplement their profile:
- From March 15 through April 11, Wallet A received a total of $200 million from Binance, across five separate days (example hashes here and here). Each time, Wallet A deposited the inflow into Anchor (corresponding hashes here and here).
- This made this account the sixth-largest holder of aUST as of Friday, May 6 (excluding protocols, bridges, and wallets held by Terraform Labs).[15]
- Outside of these transactions, the account was mostly inactive.
- Wallet A’s activity does not seem to fit that of a sophisticated trading operation for the following reasons.
- First, the account was a base account and not a multi-signature account, as @larry0x has noted.
- Second, the account apparently made a "fat finger" error — withdrawing $100 million from Anchor when they meant to withdraw $10 million from Anchor, on April 25 (hashes here and here).
- Third, the account overpaid for using Wormhole on May 7 (hash here).
- As one counterpoint, Wallet A's transaction in the Curve pool on May 7 did utilize Flashbots, suggesting an awareness of Miner Extractable Value (MEV).
- Interestingly, Wallet A seemed to have prepared for the Curve trade earlier in the day. In particular, at 16:33 and 16:49 respectively, Wallet A tested a small transaction bridging UST from Terra to Ethereum via Wormhole (hash here) and funded the Ethereum account from Binance with around 0.5 ETH for future gas fees (hash here).
A few hours later (0:00 - 1:00 GMT, on Sunday, May 8), Wallet A sent all the accumulated USDC to an account at Coinbase in nine clips of $9 million and one residual clip of $3.5 million (example hashes here and here). For easy reference, Wallet A’s Ethereum address can be found here and the linked Terra address can be found here.
Outflows from Anchor
Overview
- There were large outflows from Anchor depositors overnight on Saturday, May 7, and in the late morning of Monday, May 9.
- These outflows put pressure on the peg, with the second set of outflows driving it meaningfully away from that peg.
- A handful of large depositors disproportionately drove the outflows. By contrast, small depositors increased their exposure to Anchor through these three days.
- There were large forced liquidations of Anchor borrowers during this episode, although we do not believe these added meaningful pressure on UST.
Outflows across Time
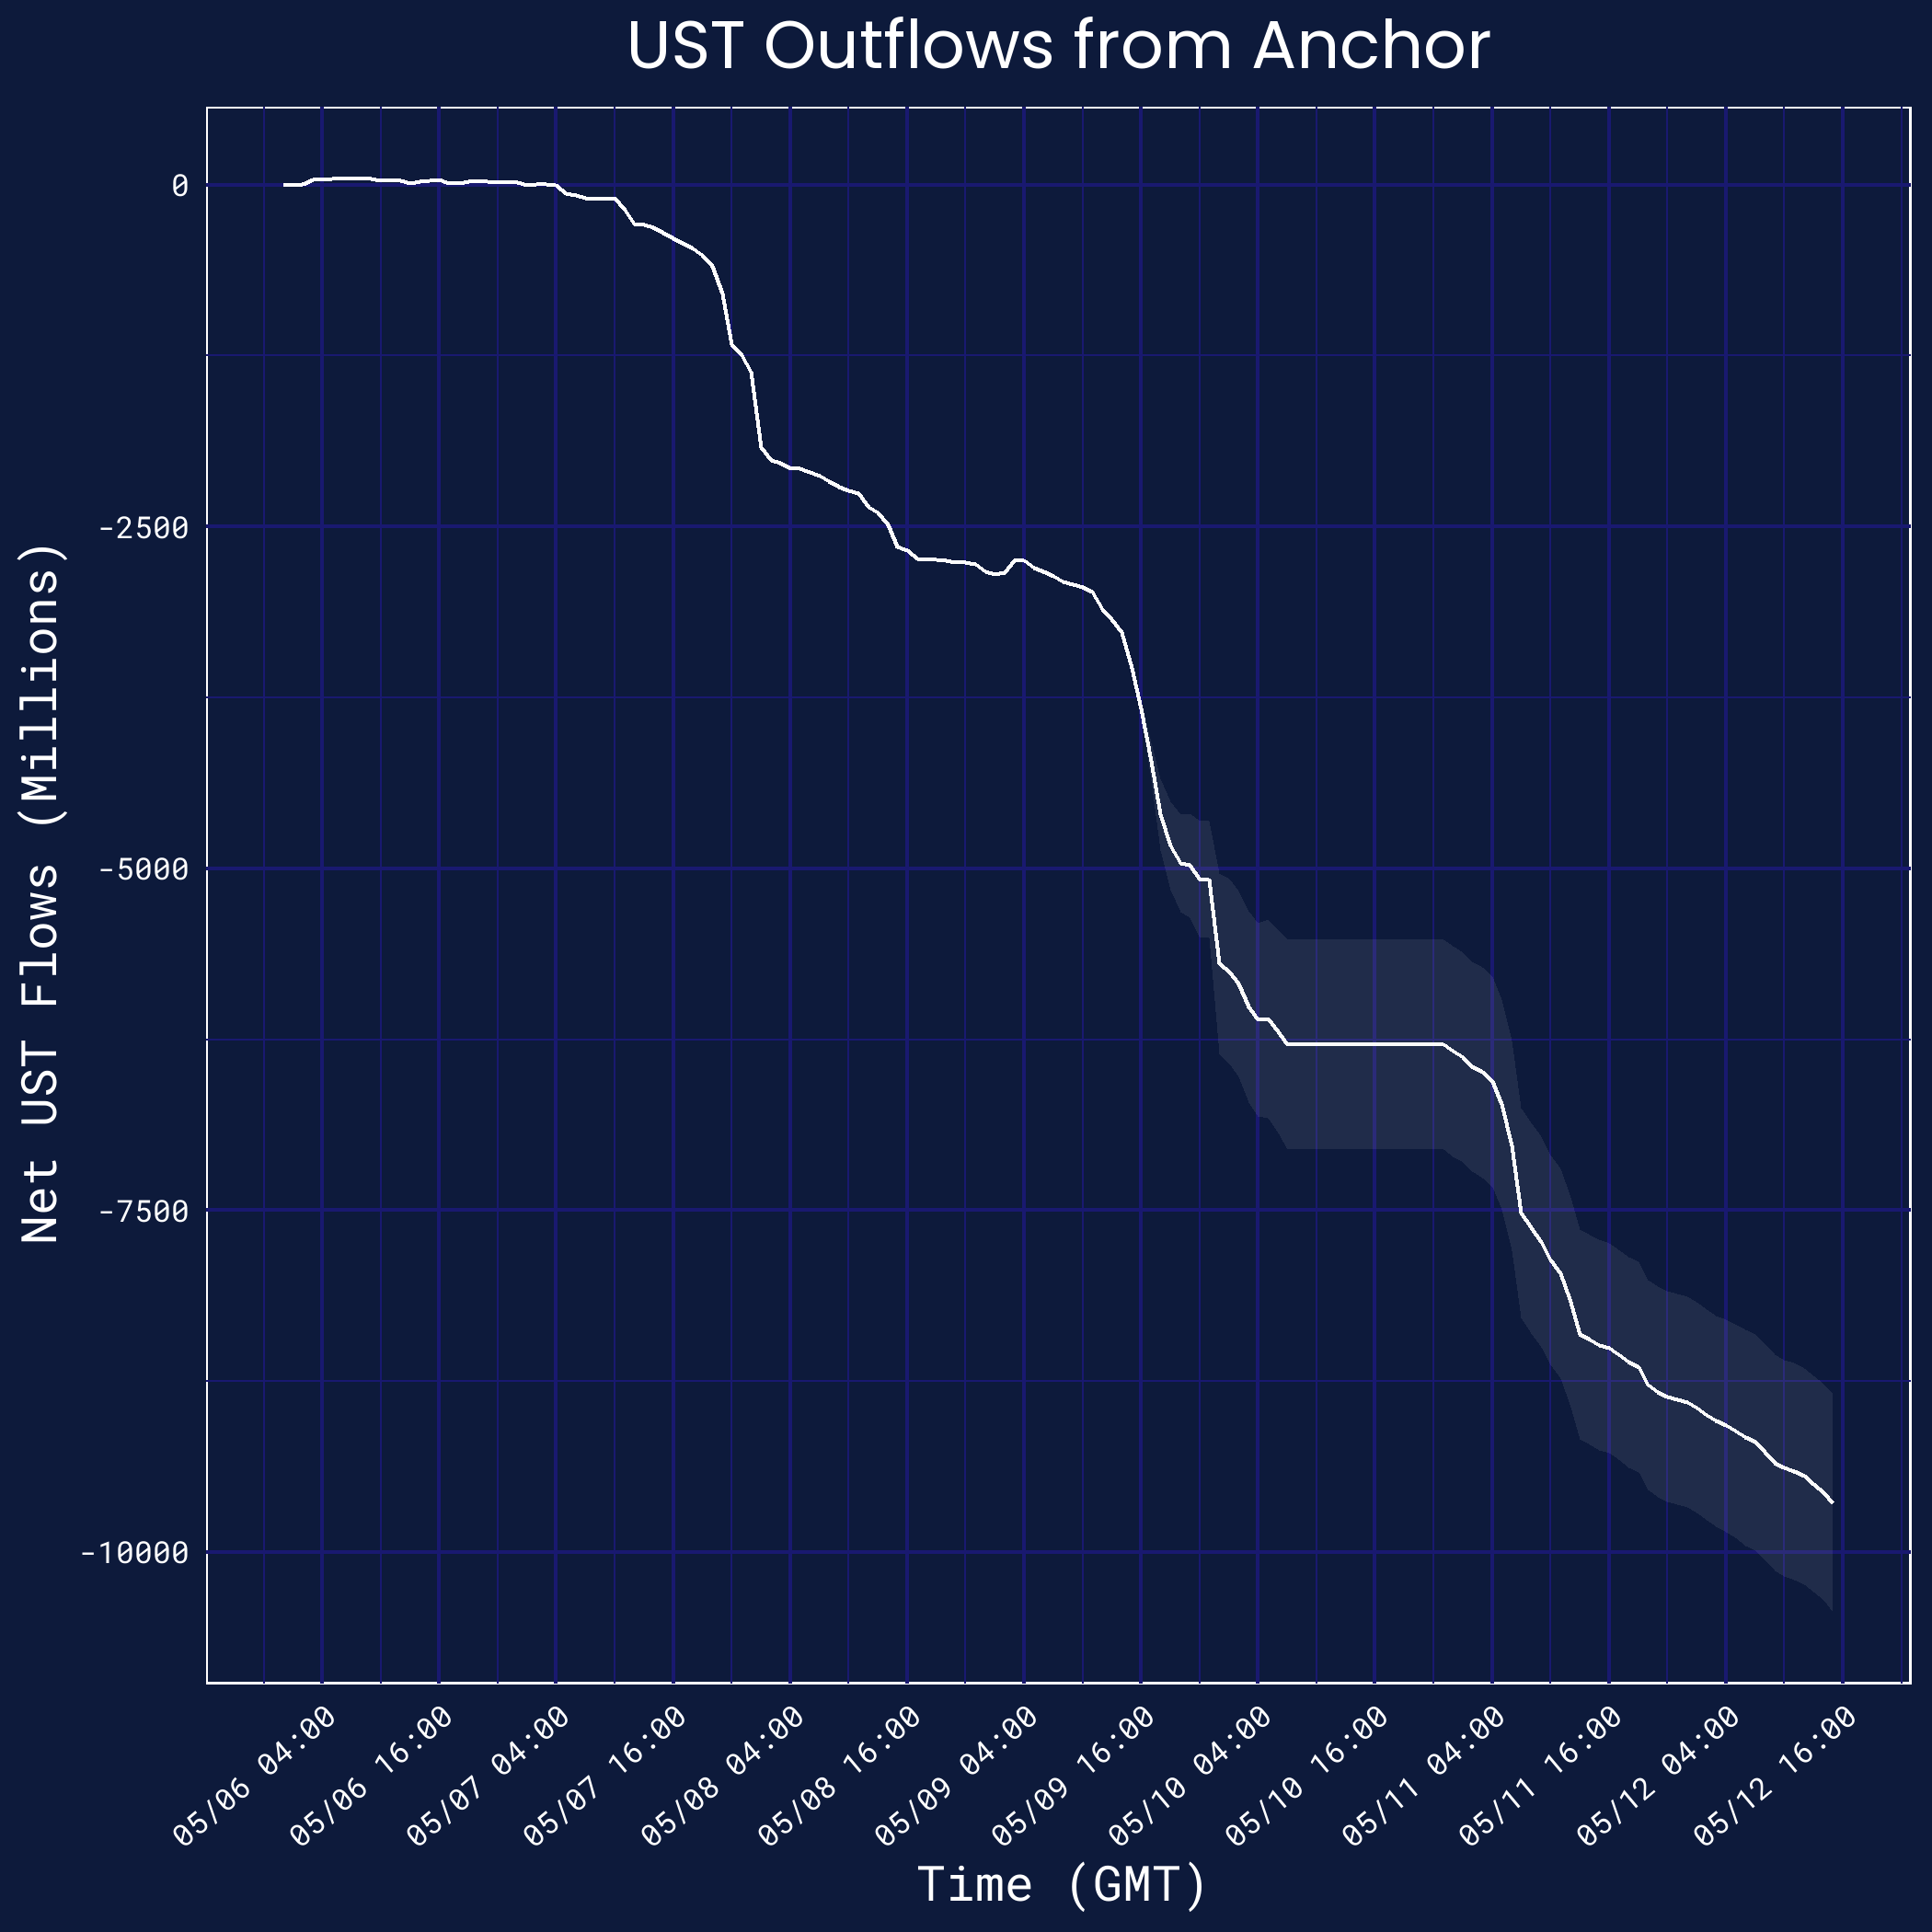
As the location of 75% of outstanding UST on the eve of this episode, actions at Anchor played a critical role in driving UST away from its peg.[16] To illustrate this, we first show the cumulative flows from Anchor, plotted on an hourly basis. Note that some blocks on the Terra network were missed on May 9 by our data aggregator, Flipside Crypto, and so the graph plots an appropriate confidence interval as the shaded gray region.[17]
Critically, the graph shows both the speed and scale of outflows. These reach a cumulative $10 billion over one week, with around $5 billion in those first three days.
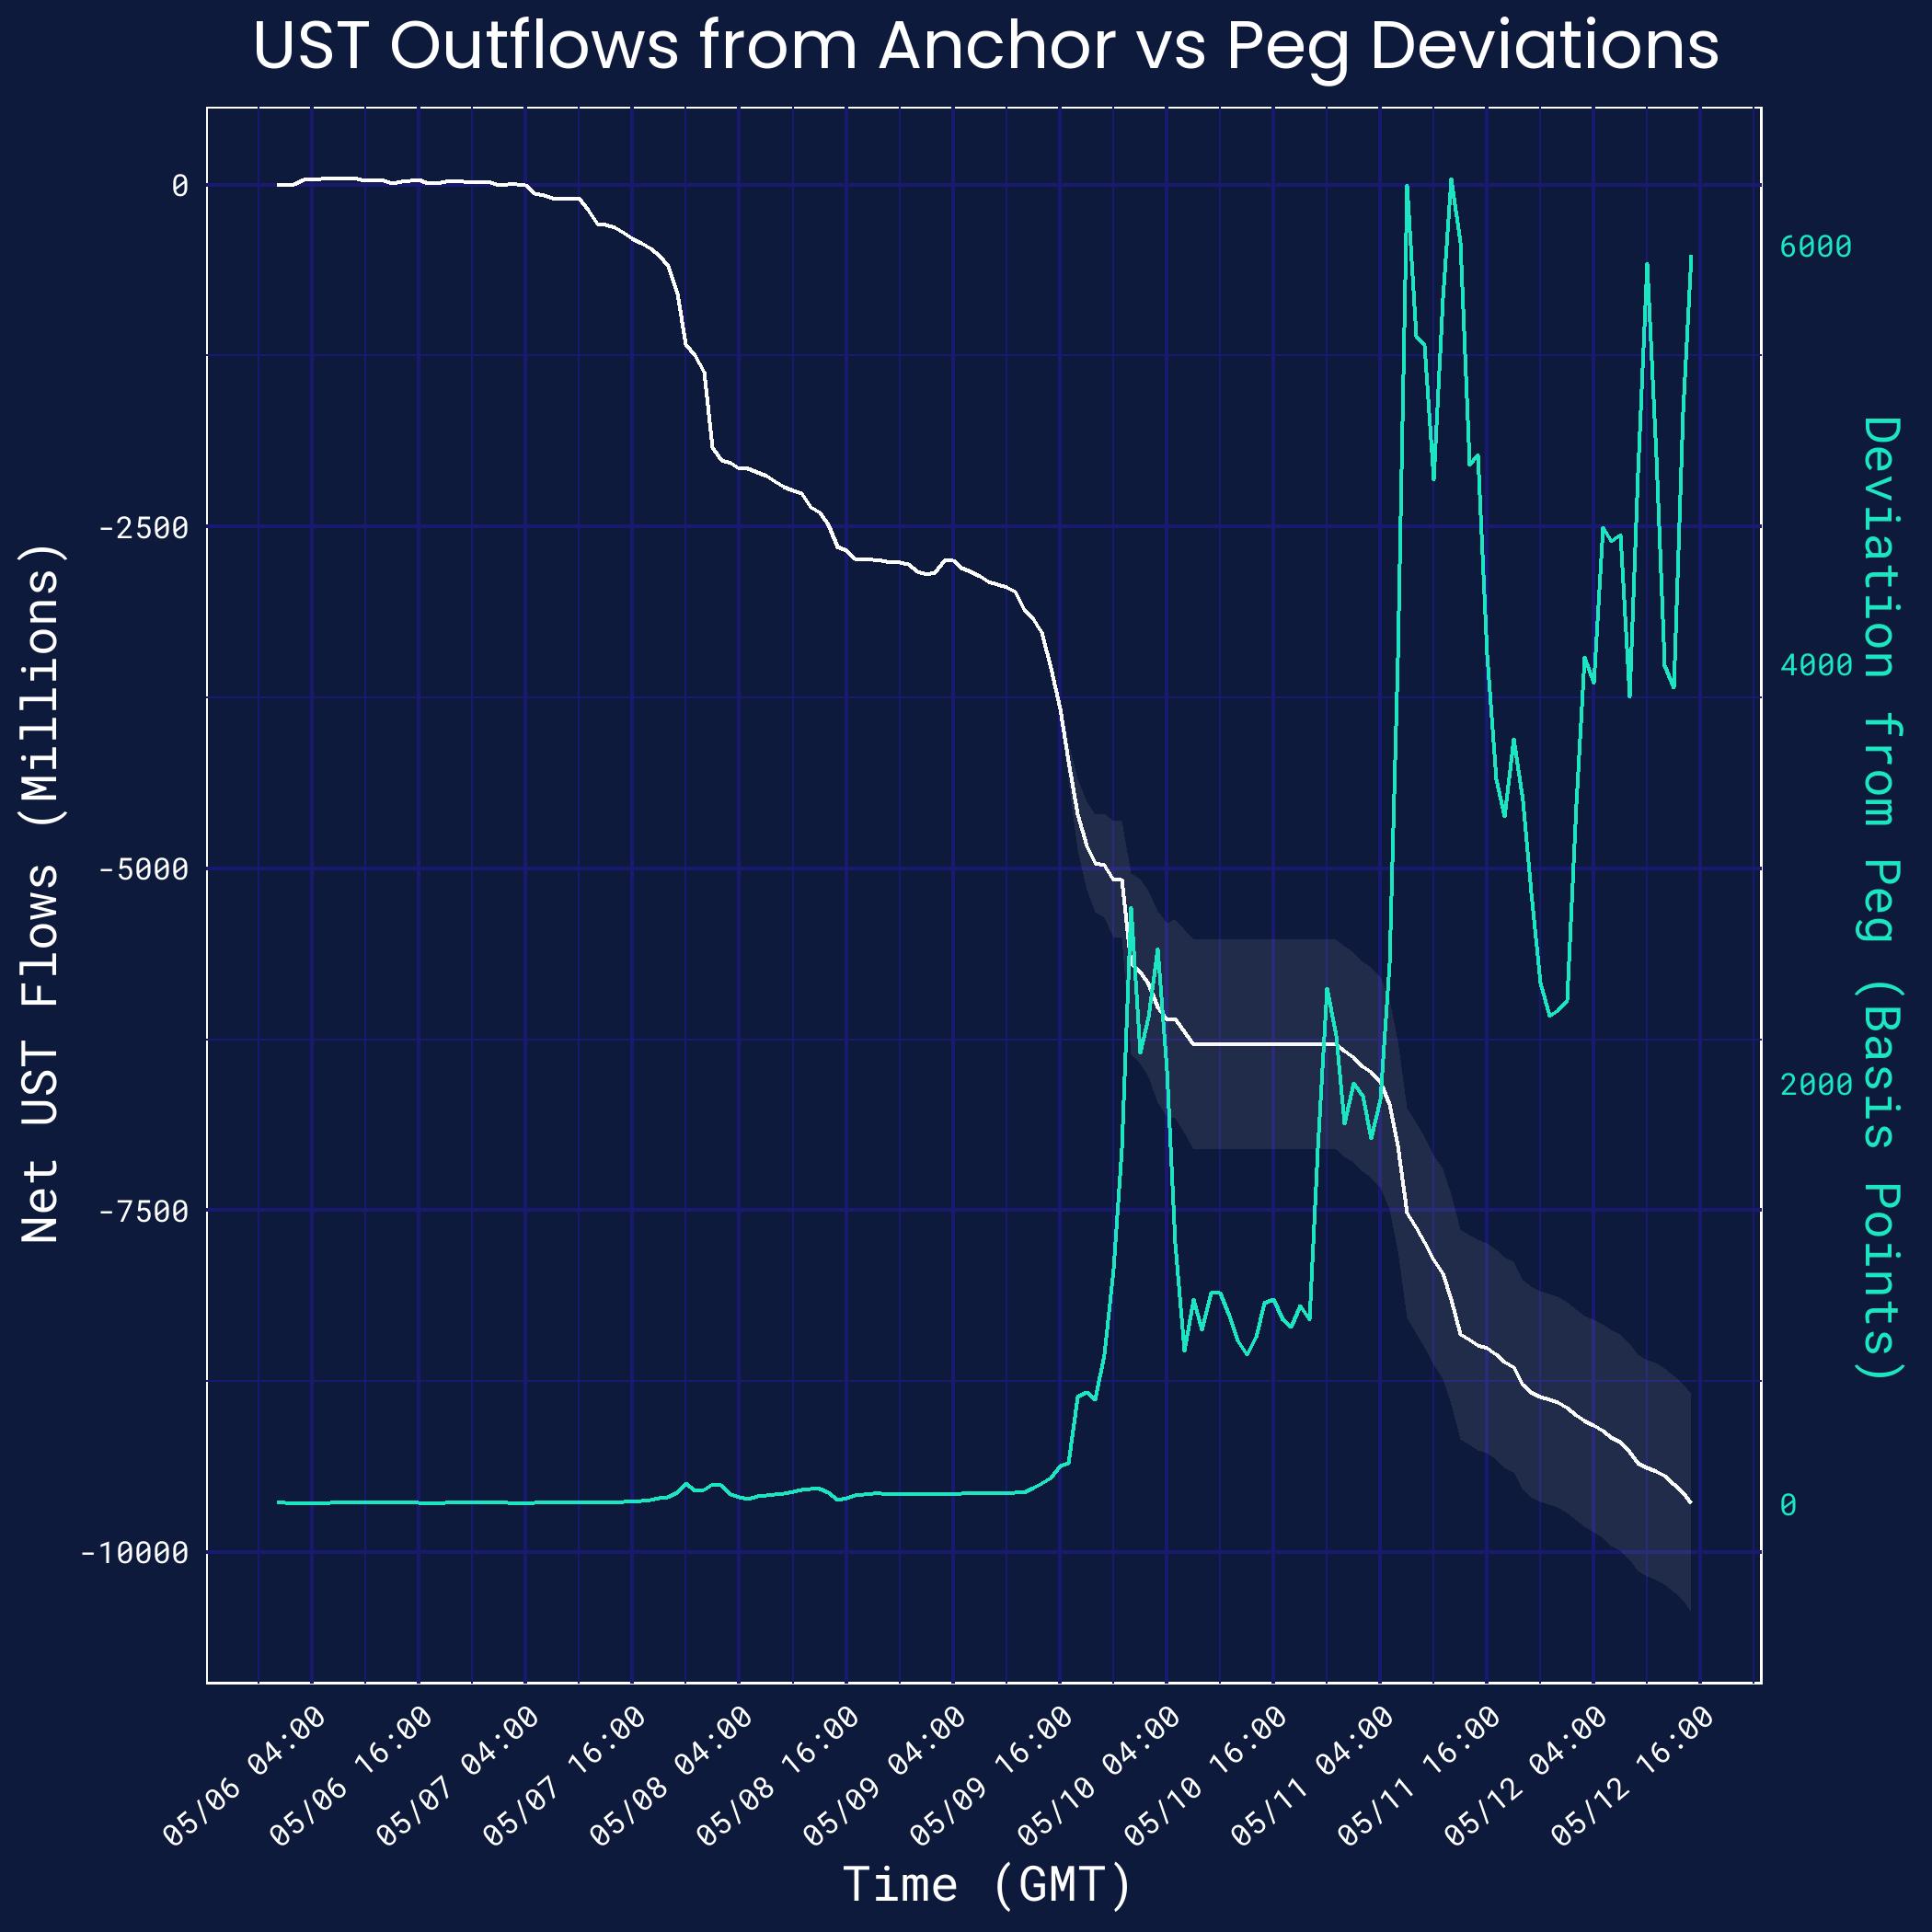
To draw the link between Anchor outflows and the UST peg in sharper focus, we next plot them side-by-side.[18][19] This now illustrates three key epochs for the outflows from Anchor over those three days.
- On the evening of Saturday, May 7, and early morning of Sunday, May 8 (GMT), there was a strong outflow of nearly $2.5 billion, but the peg largely held.
- Throughout May 8 and early morning of Monday, May 9, there was relative stability in Anchor and the peg alike.
- During the late morning and afternoon of May 9, the outflows started again and UST deviated strongly from the peg. Thereafter, the relationship between Anchor’s outflows and the peg became less tight.
Outflows across Depositors
We also explore the cross-section of Anchor depositors through these three days. To do so, we classify all Anchor depositors into three groups: small ones, mid-sized ones, and large ones (defined below). We exclude bridges, protocols, and known wallets owned by Terraform Labs.
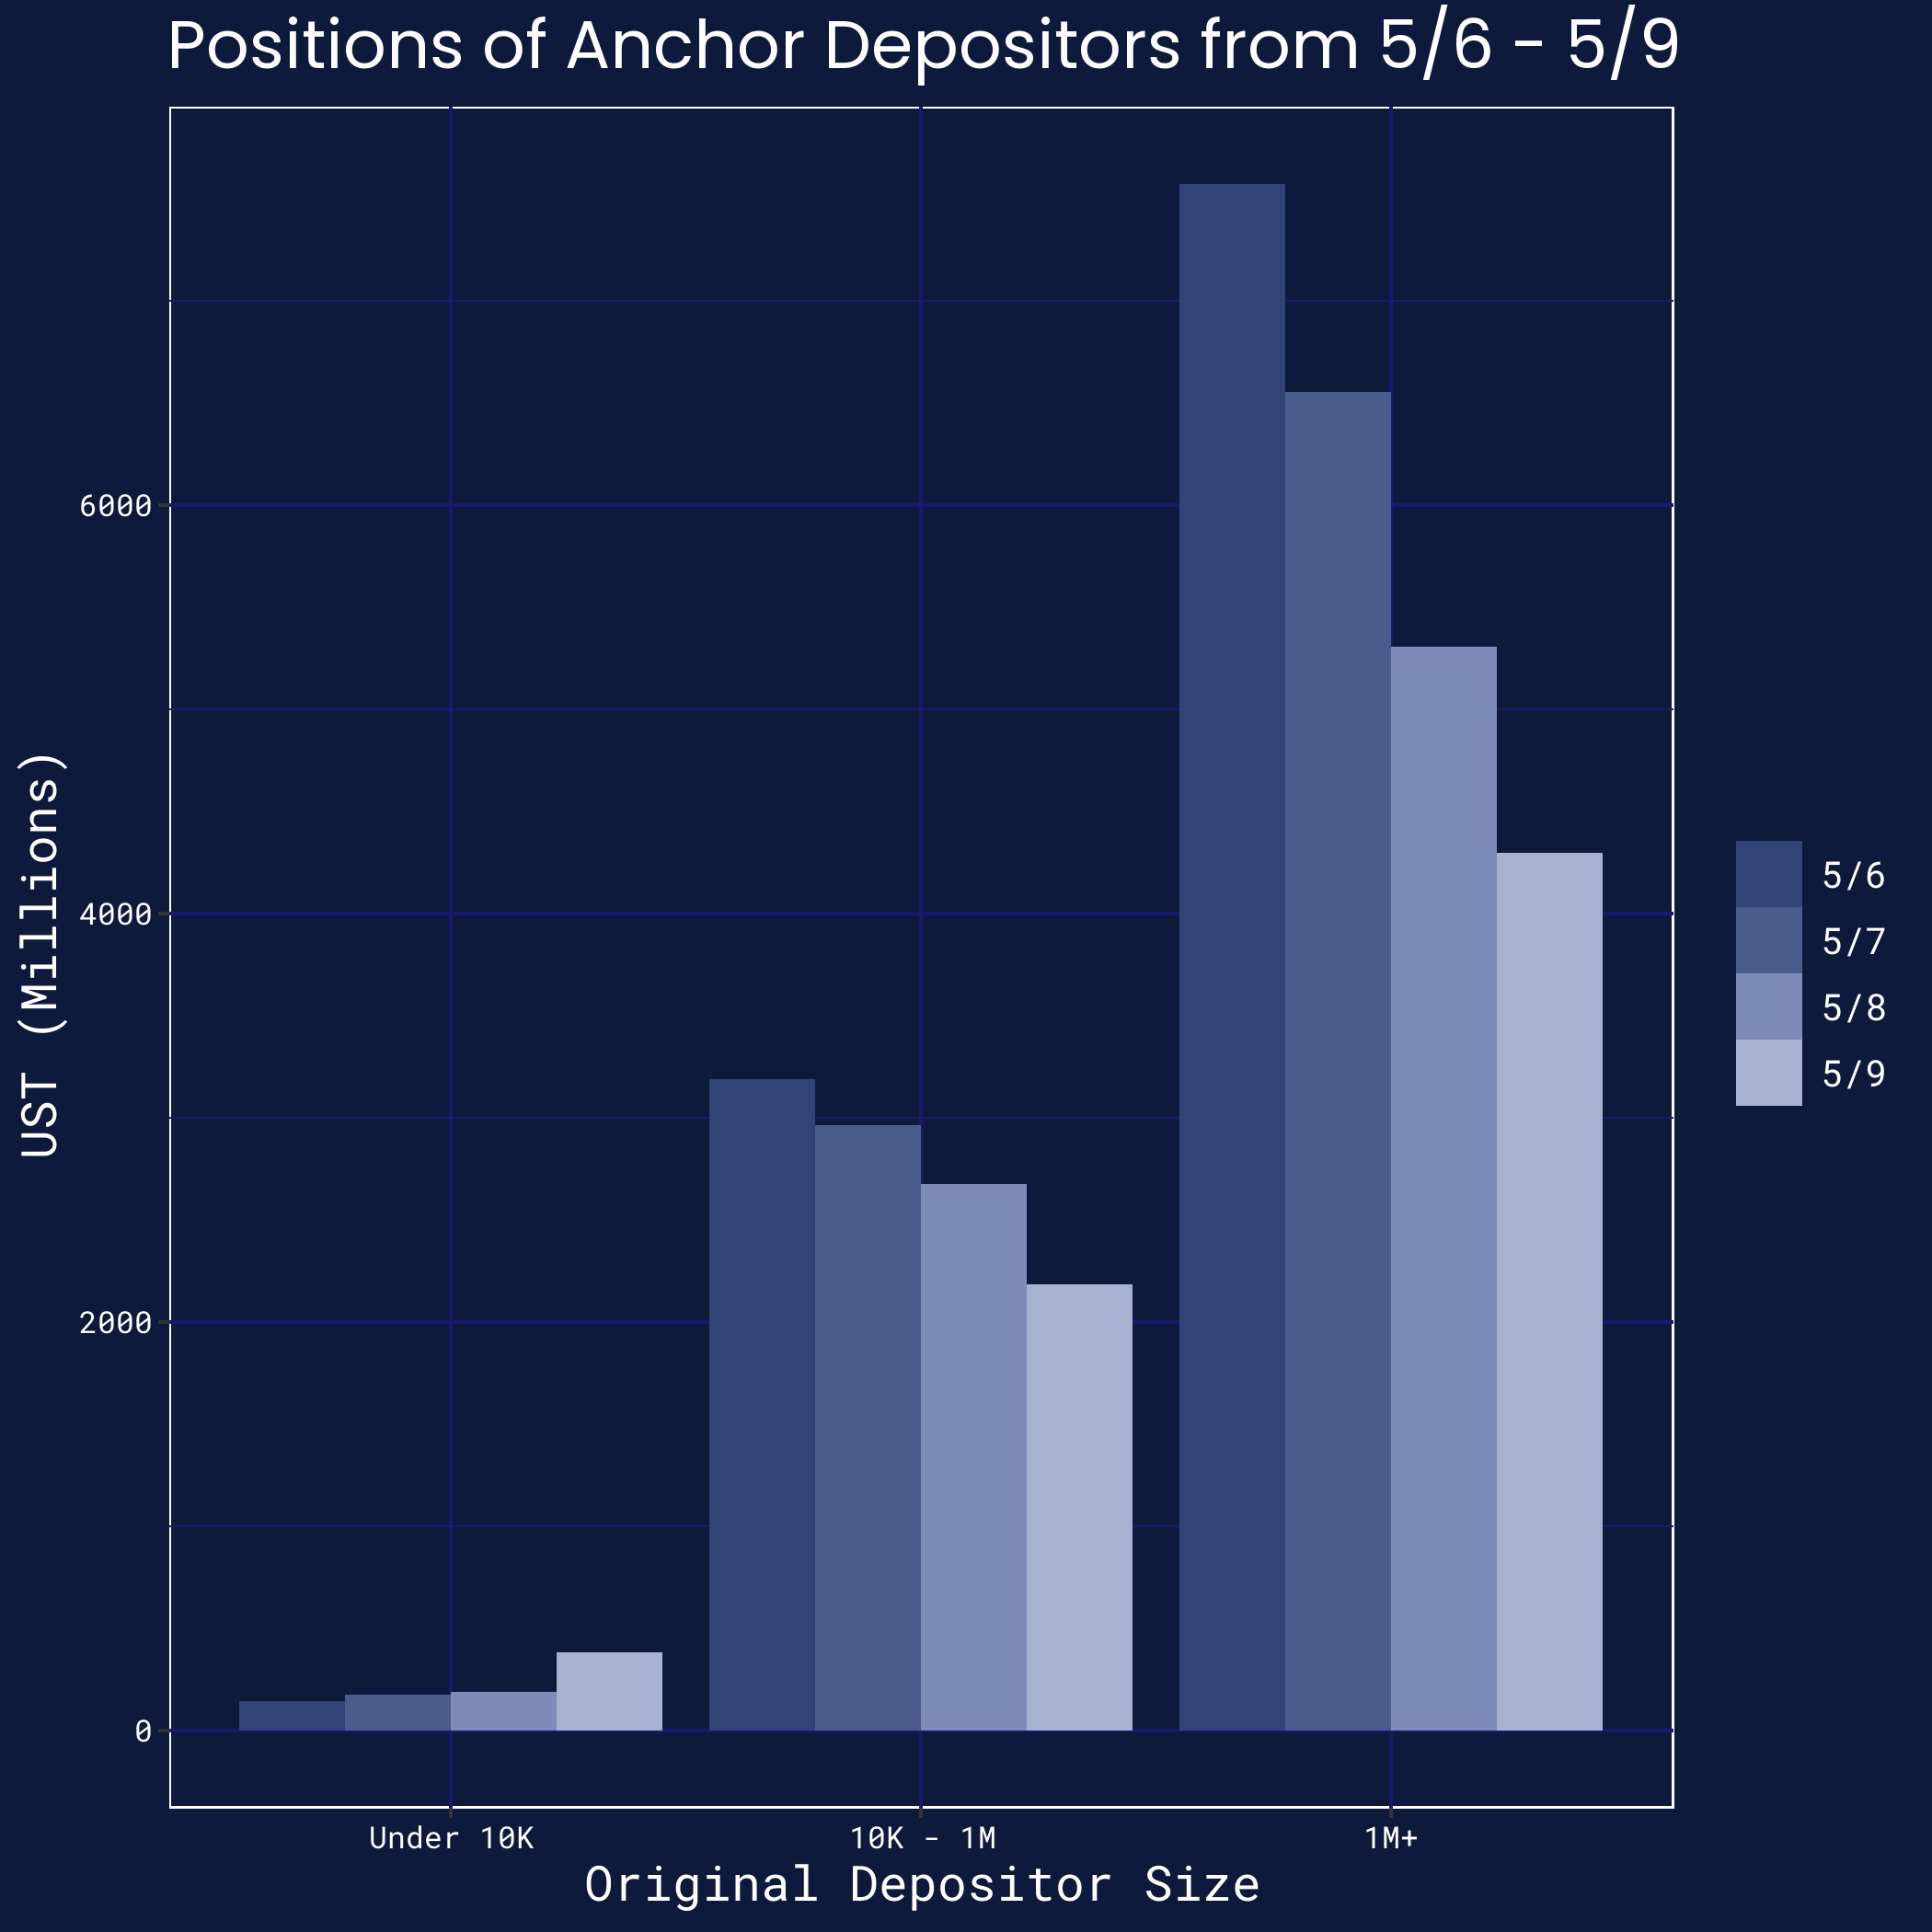
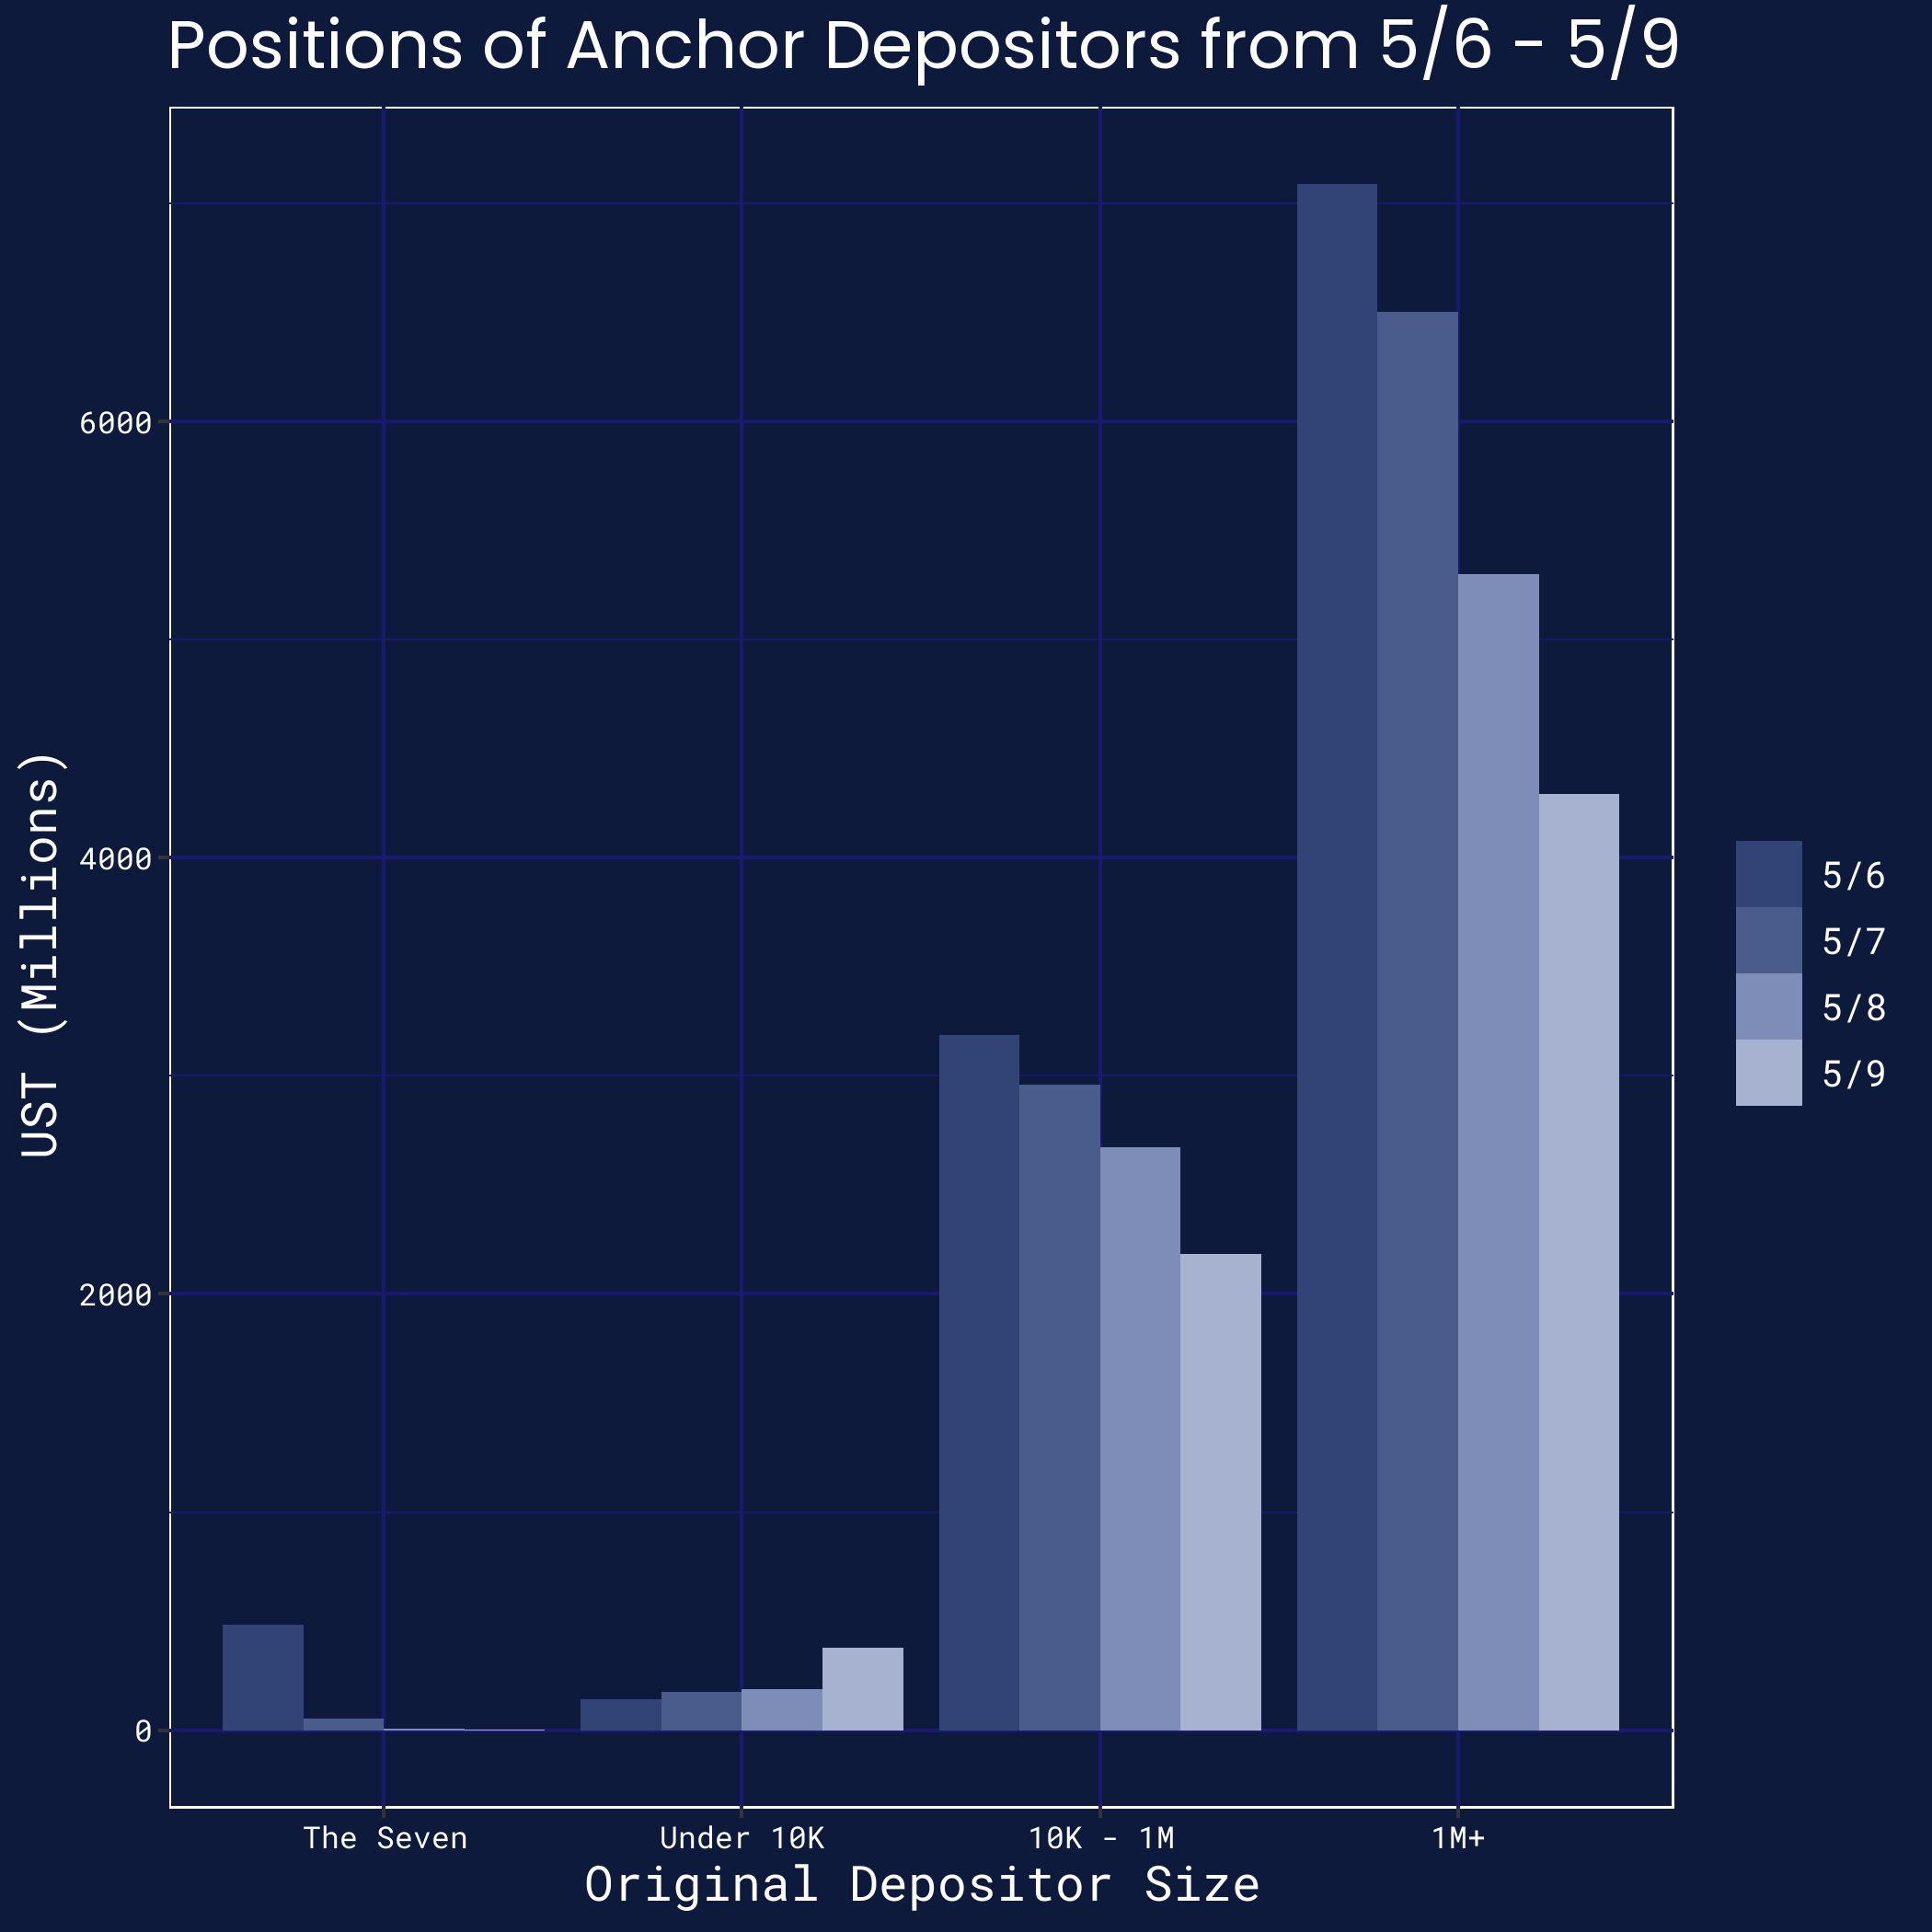
The graph below shows their respective drawdowns through the UST collapse, and shows diverging behavior for these three groups.[20] Note that due to some data incompleteness with Flipside Crypto, the magnitudes may be under-reported, but we believe the proportionality is nonetheless represented accurately. We find the following results:
- Large depositors (wallets with over $1 million in Anchor deposits on May 6) fled the protocol quickly, running down almost 15% of their position almost immediately and over 40% of their position over the first three days of these events.
- Mid-sized depositors (wallets with $10,000 - $1 million in Anchor deposits on May 6) fled the protocol less rapidly, running down 5% of their position immediately and 30% over the first three days.
- Small depositors (wallets with less than $10,000 in Anchor deposits on May 6) increased their exposure to Anchor. However, their total position size was an order-of-magnitude smaller than that of mid-sized and large depositors, and so this increased exposure was insufficient to counteract the outflows.
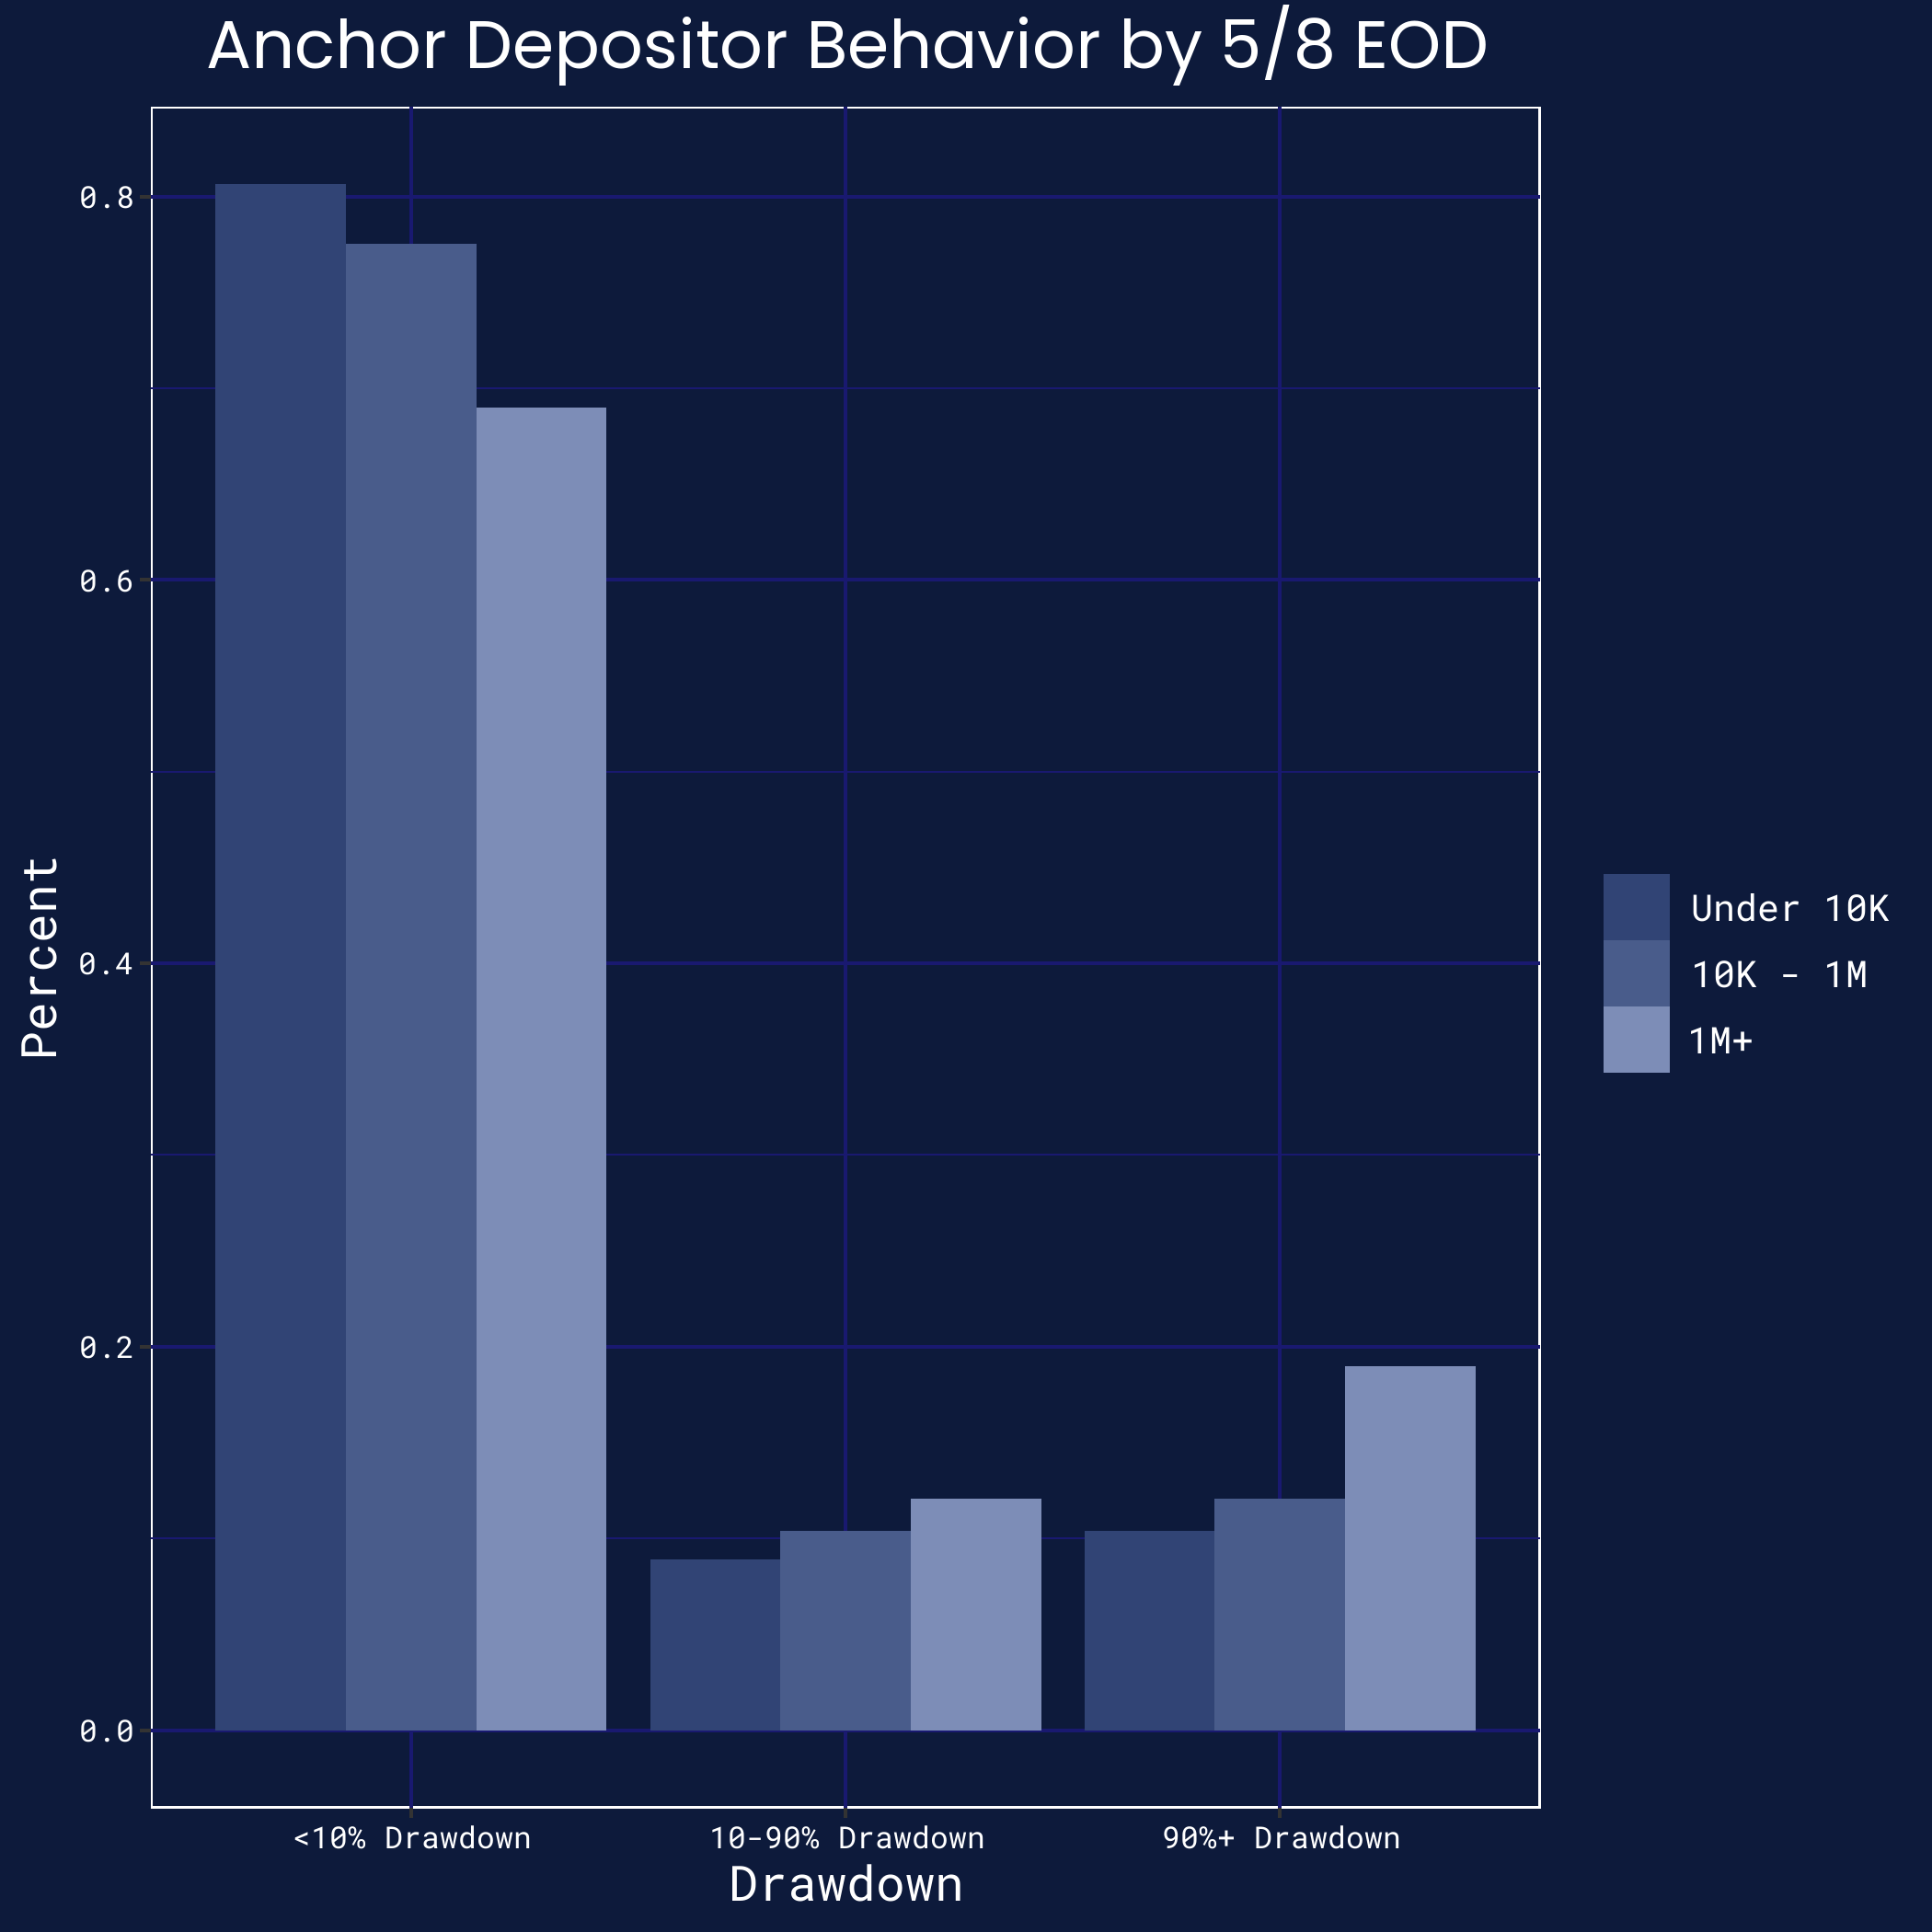
Moreover, not only did the outflows stem from larger depositors — they also stemmed from a handful of those depositors. We classify Anchor depositors into three camps:
- Depositors who, as of May 9, had fully exited the Anchor positions they had on May 6 (i.e. they retained less than 10% of their original position)
- Depositors who, as of May 9, had partially exited (i.e. they retained 10-90% of their original position)
- Depositors who, as of May 9, had not exited (i.e. they retained more than 90% of their original position)
We plot the fractions below and find that many depositors — across the spectrum — had kept their Anchor positions.[21] But a handful had entirely closed their positions, and they were more likely to be large depositors. (Appendix A.2 repeats this exercise as of May 8.)
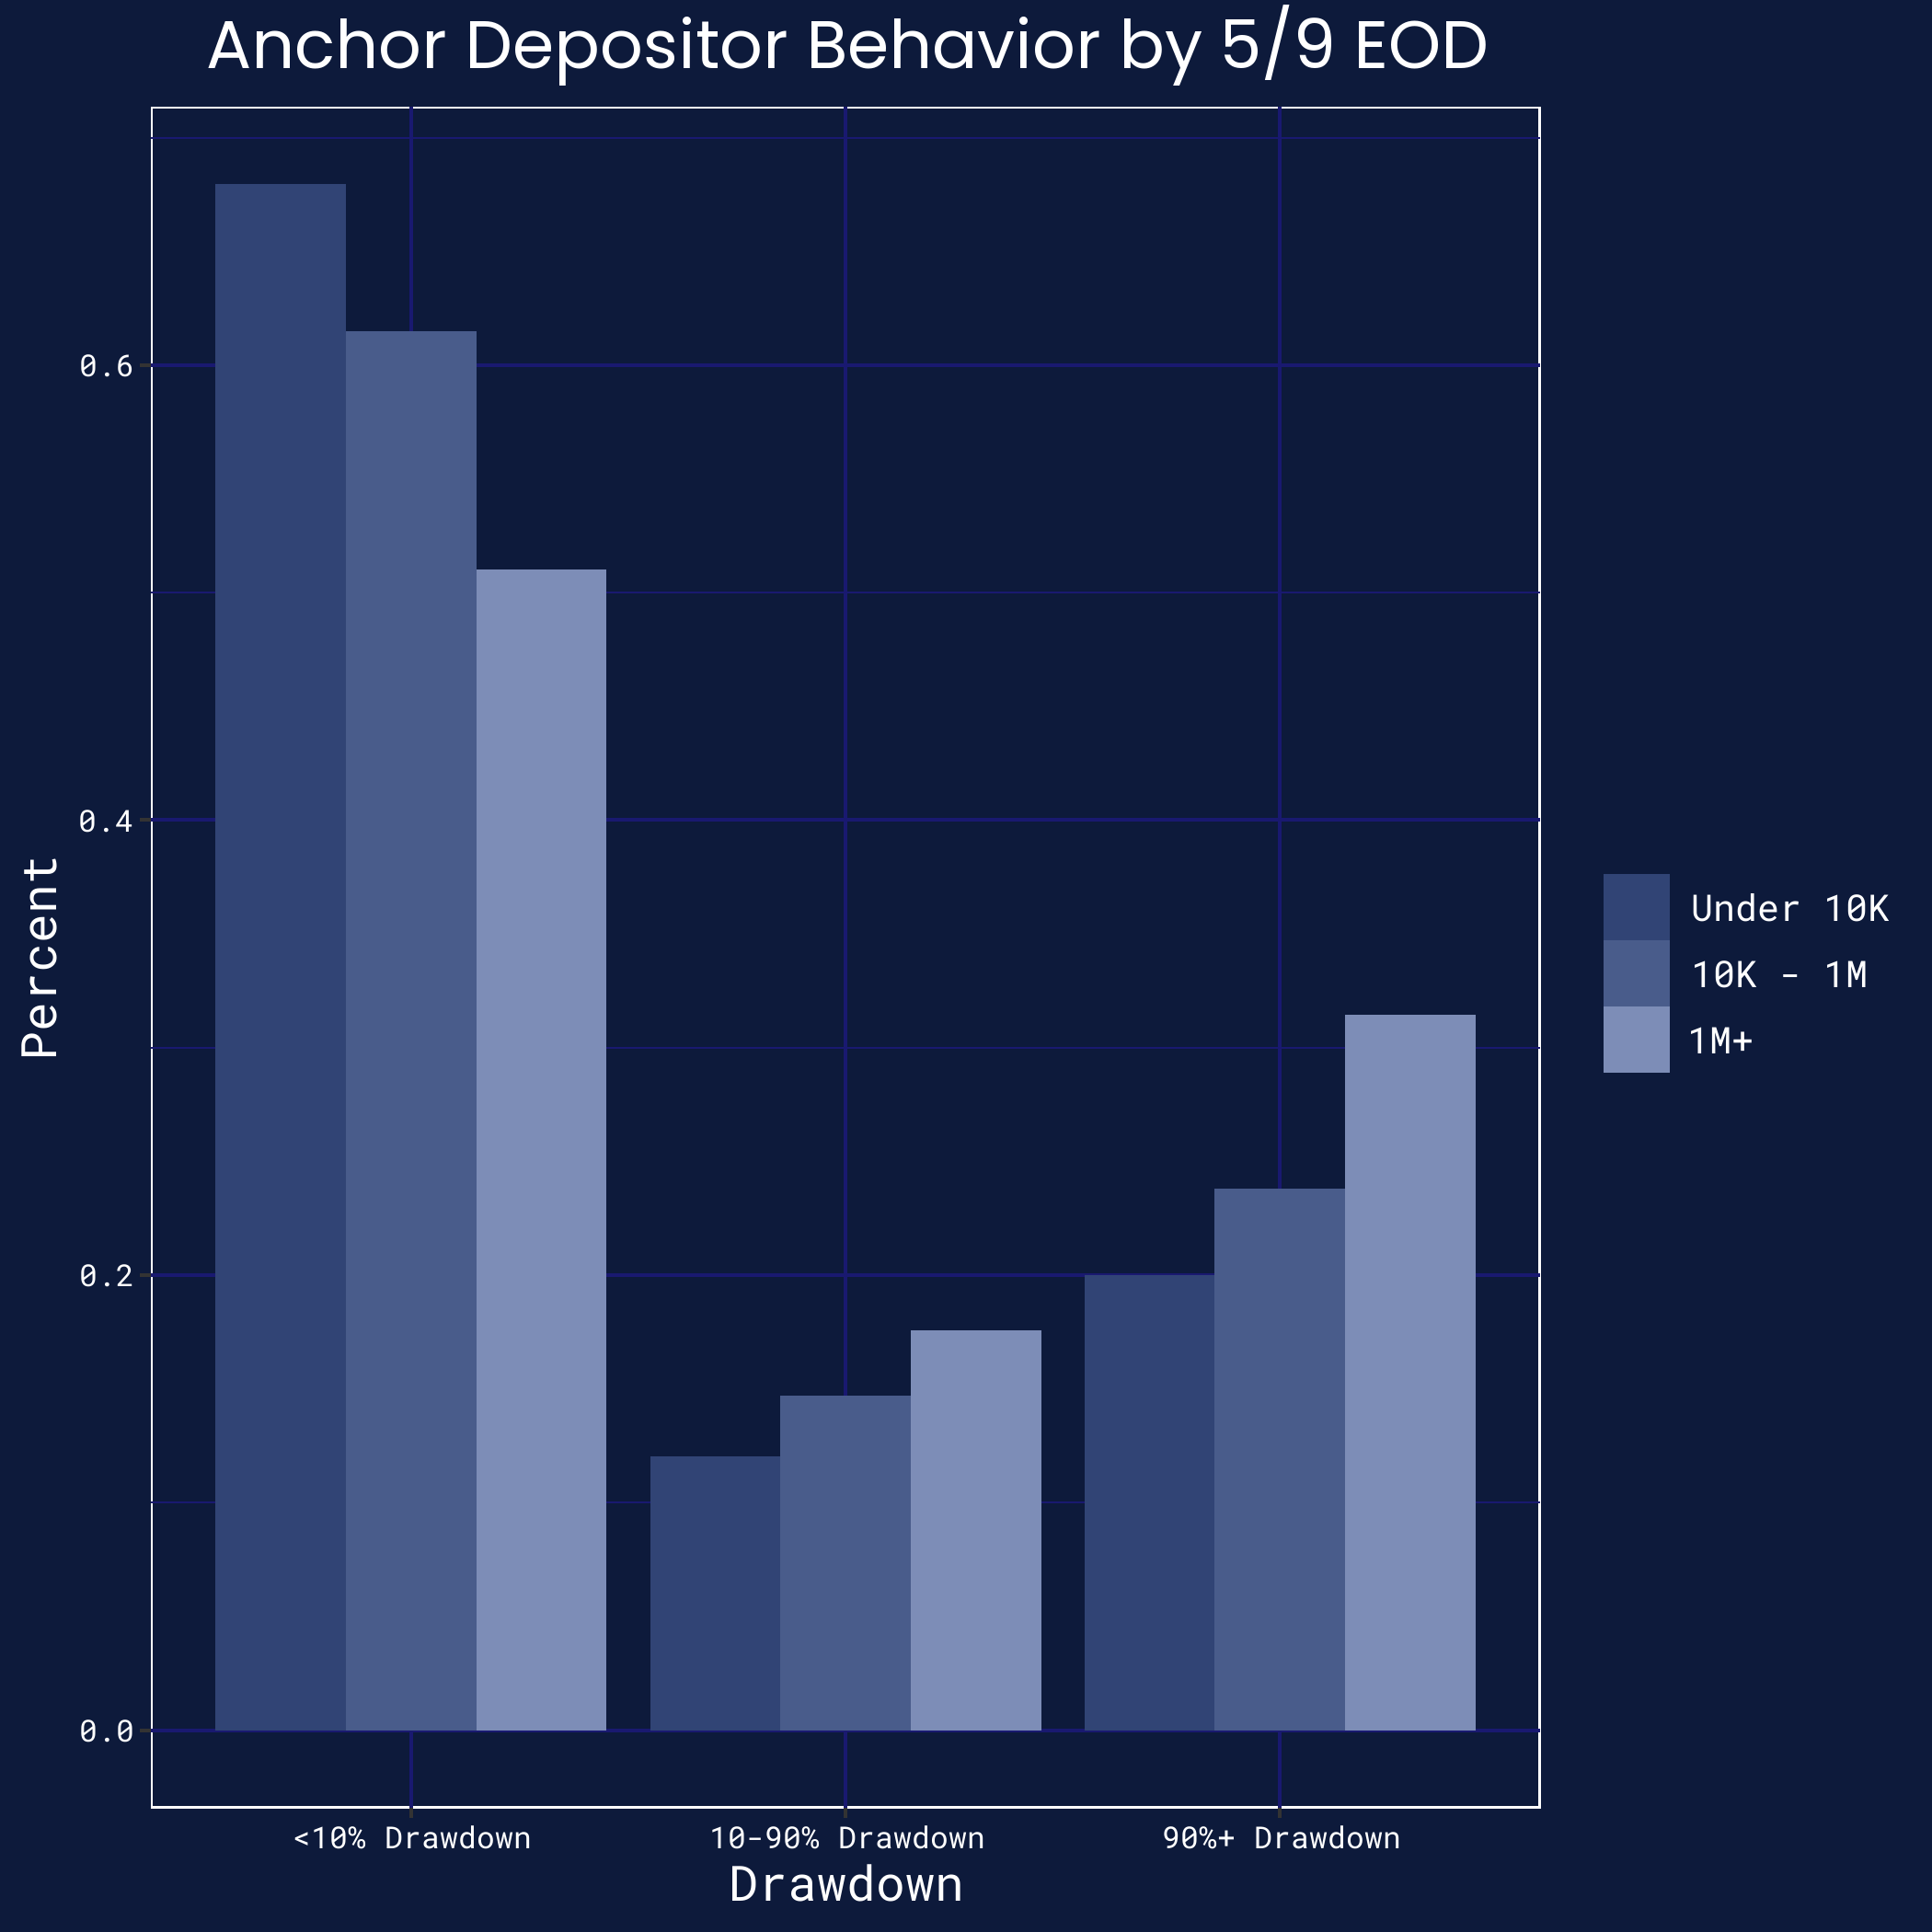
In their report, Nansen.ai highlights seven particular wallets ("The Seven") as driving the Anchor outflows at the start of the UST de-peg episode. While those specific wallets did indeed comprise much of the early outflow, they were part of a much broader trend. To illustrate, we plot the original graph of daily drawdowns across small, mid-sized, and large depositors — and break out "The Seven" as a separate group.[22] They indeed represent a rapid drawdown that was mirrored more generally by other large wallets.
Borrower Liquidations
We finally examine forced liquidations at Anchor by borrowers, who had deposited bLUNA, bETH, and other collateral. Some commentators have noted that the pace of liquidations at Anchor may have fueled these events further, given the falling prices in crypto markets (especially in LUNA).
However, we find that forced liquidations of Anchor borrowers did not appear to play a key role in the events. This is for three reasons.
- Conceptually, the effect of liquidations on the peg is not apparent. Liquidations place downward pressure on collateral prices (e.g. LUNA) but upward pressure on UST, and shrink the net UST supply as the outstanding loans are repaid.
- Quantitatively, borrowing at Anchor was small relative to the total market capitalization of UST. At its peak, Anchor had approximately $14 billion in deposits and only $3 billion in loans.[23]
- In terms of timing, liquidations largely took place as Anchor outflows were gathering pace — and thus, at best, only added incremental pressure.
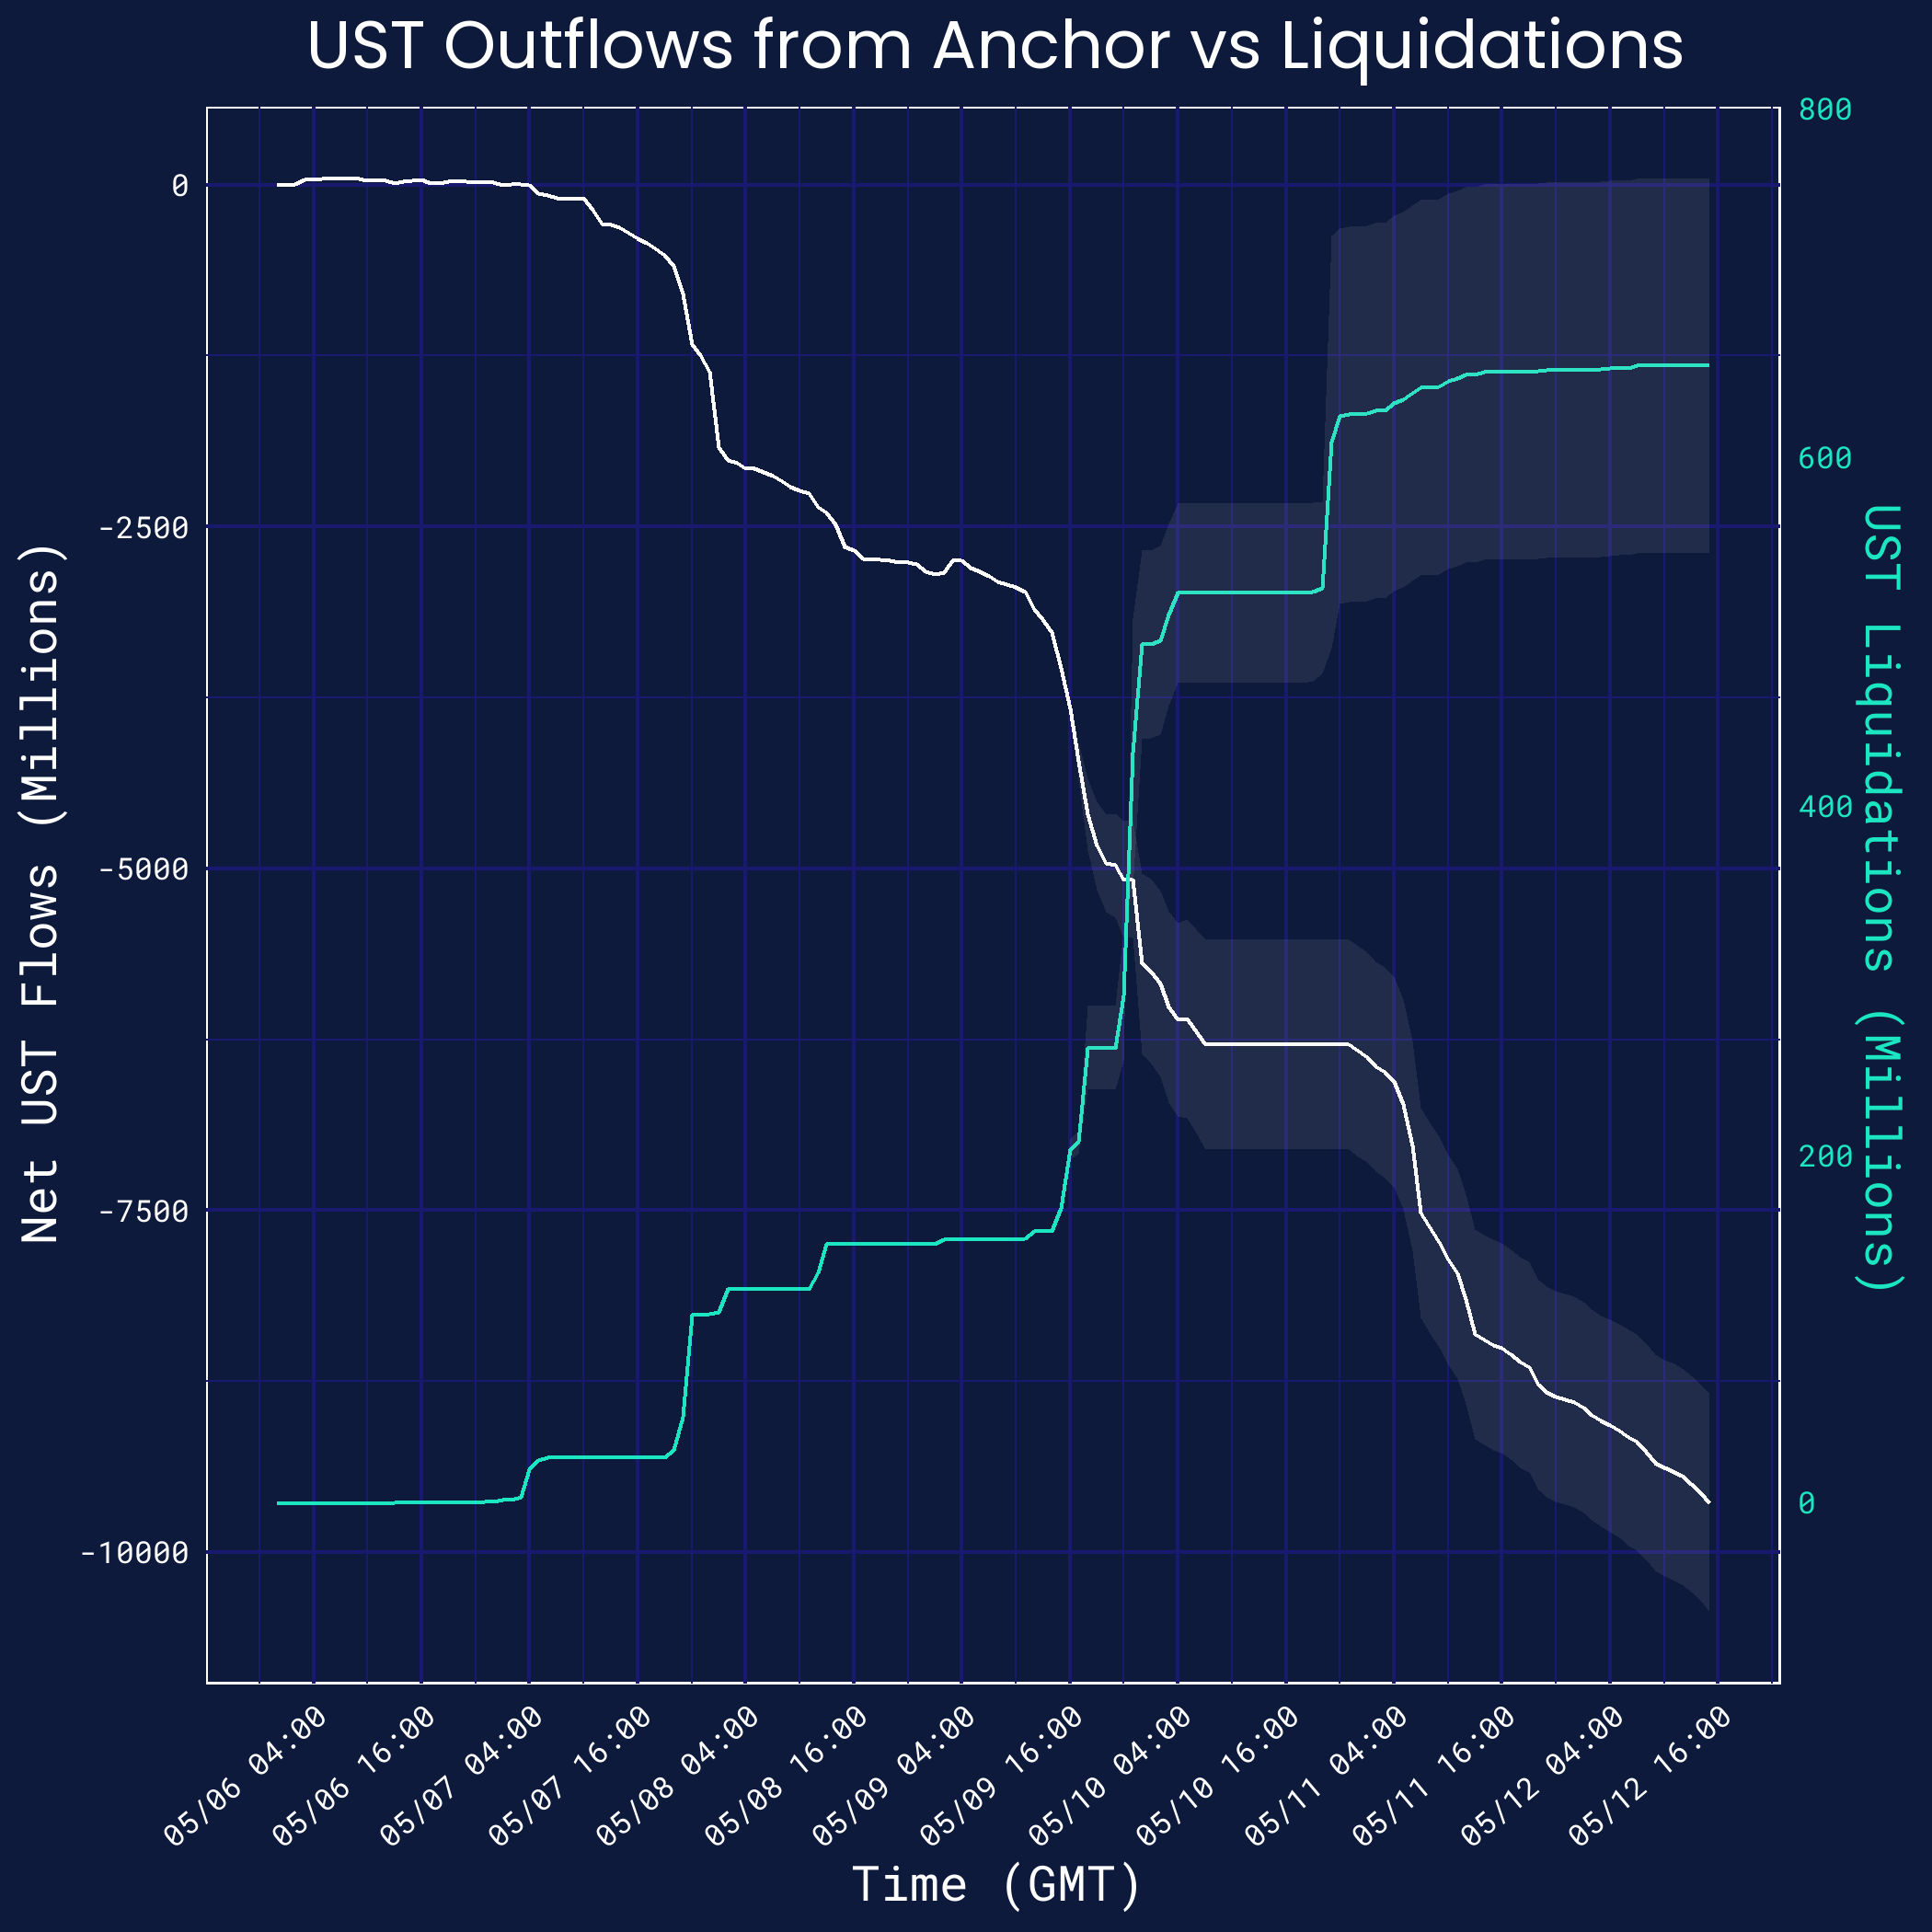
We illustrate the latter two points by graphing liquidations against Anchor outflows (plotting confidence intervals in gray, as always, due to the noise in the data stemming from missing Terra blocks on May 9).[24] Both in quantitative and visual terms, forced liquidations do not seem to play a prominent or leading role in these events.
Risk-Off Sentiment
Overview
- UST deviated from the peg by several hundred basis points during the early evening of Monday, May 9 — and risk-off (i.e. bearish) sentiment in crypto markets likely contributed to this event.
- This sentiment extended outside crypto markets, and was even felt in traditional equity markets.
Crypto Sentiment
Outside of the pressure on the Terra ecosystem, there was high volatility in markets during this episode. Macroeconomic concerns relating to inflation, slowing Chinese growth, geopolitical turmoil, and other factors manifested in a continuous selloff in crypto markets. At a high level, this coincided with the deviation of the UST peg, as the graph below illustrates.[25][26]
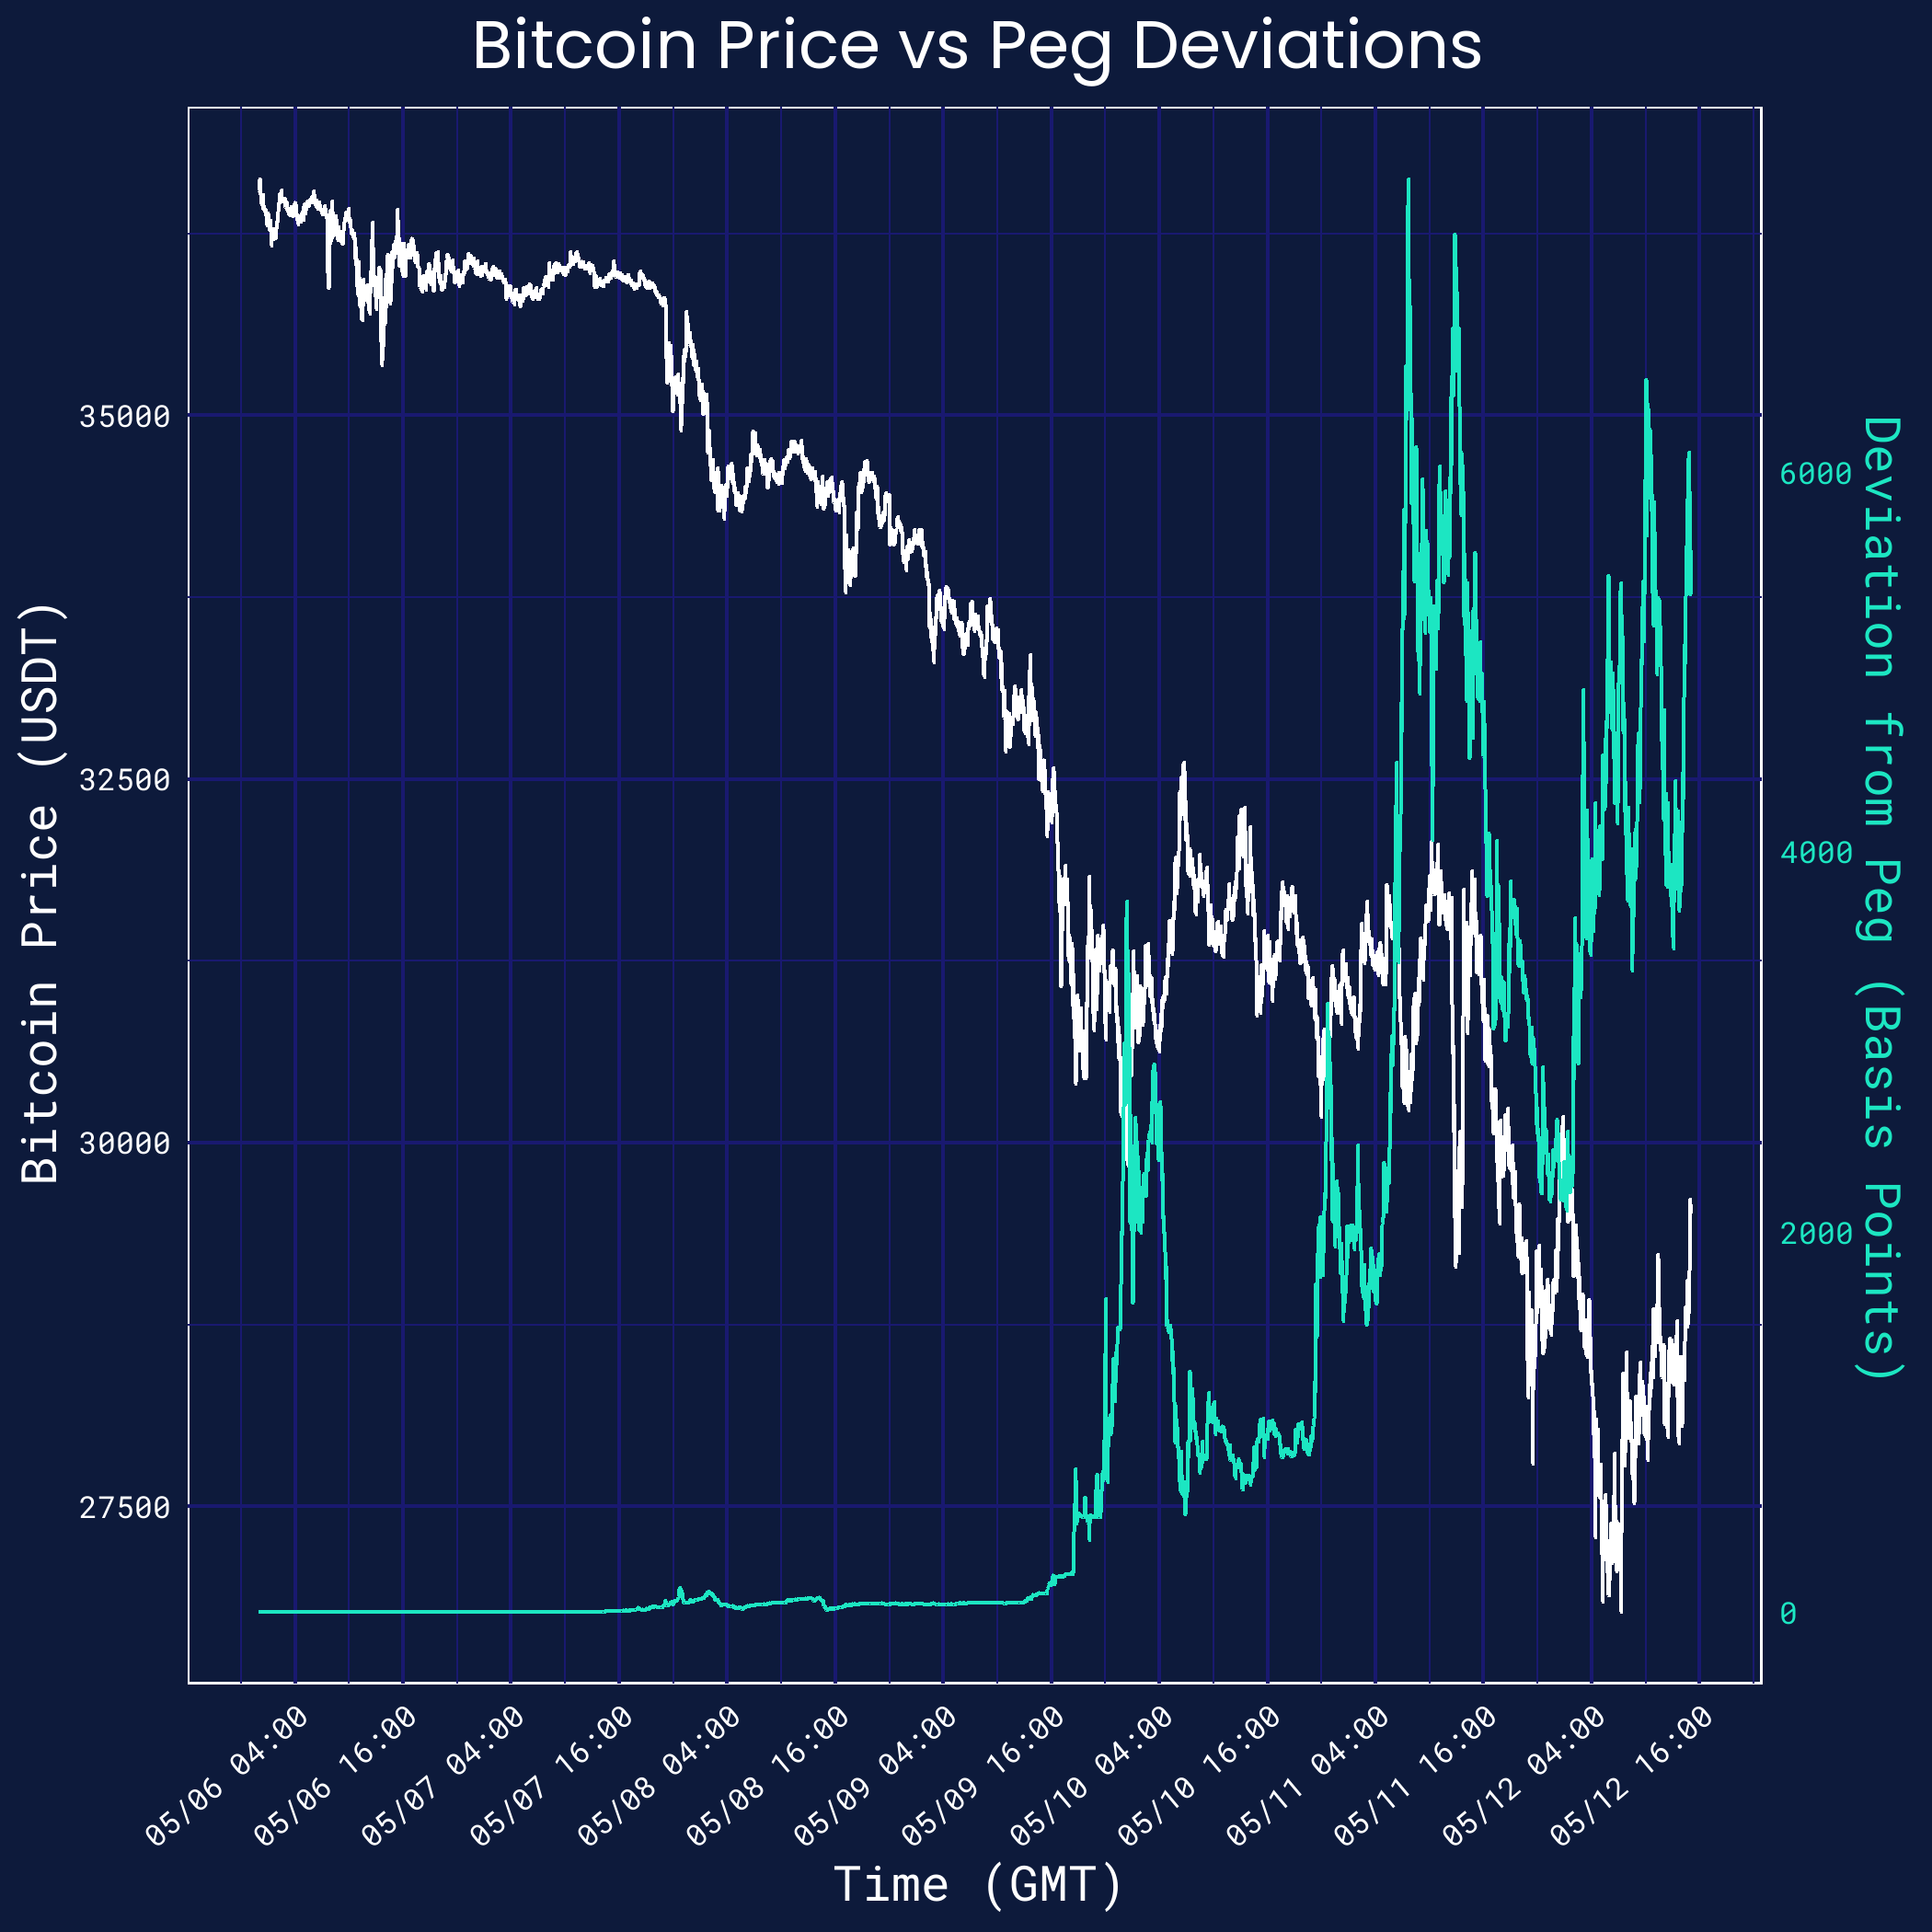
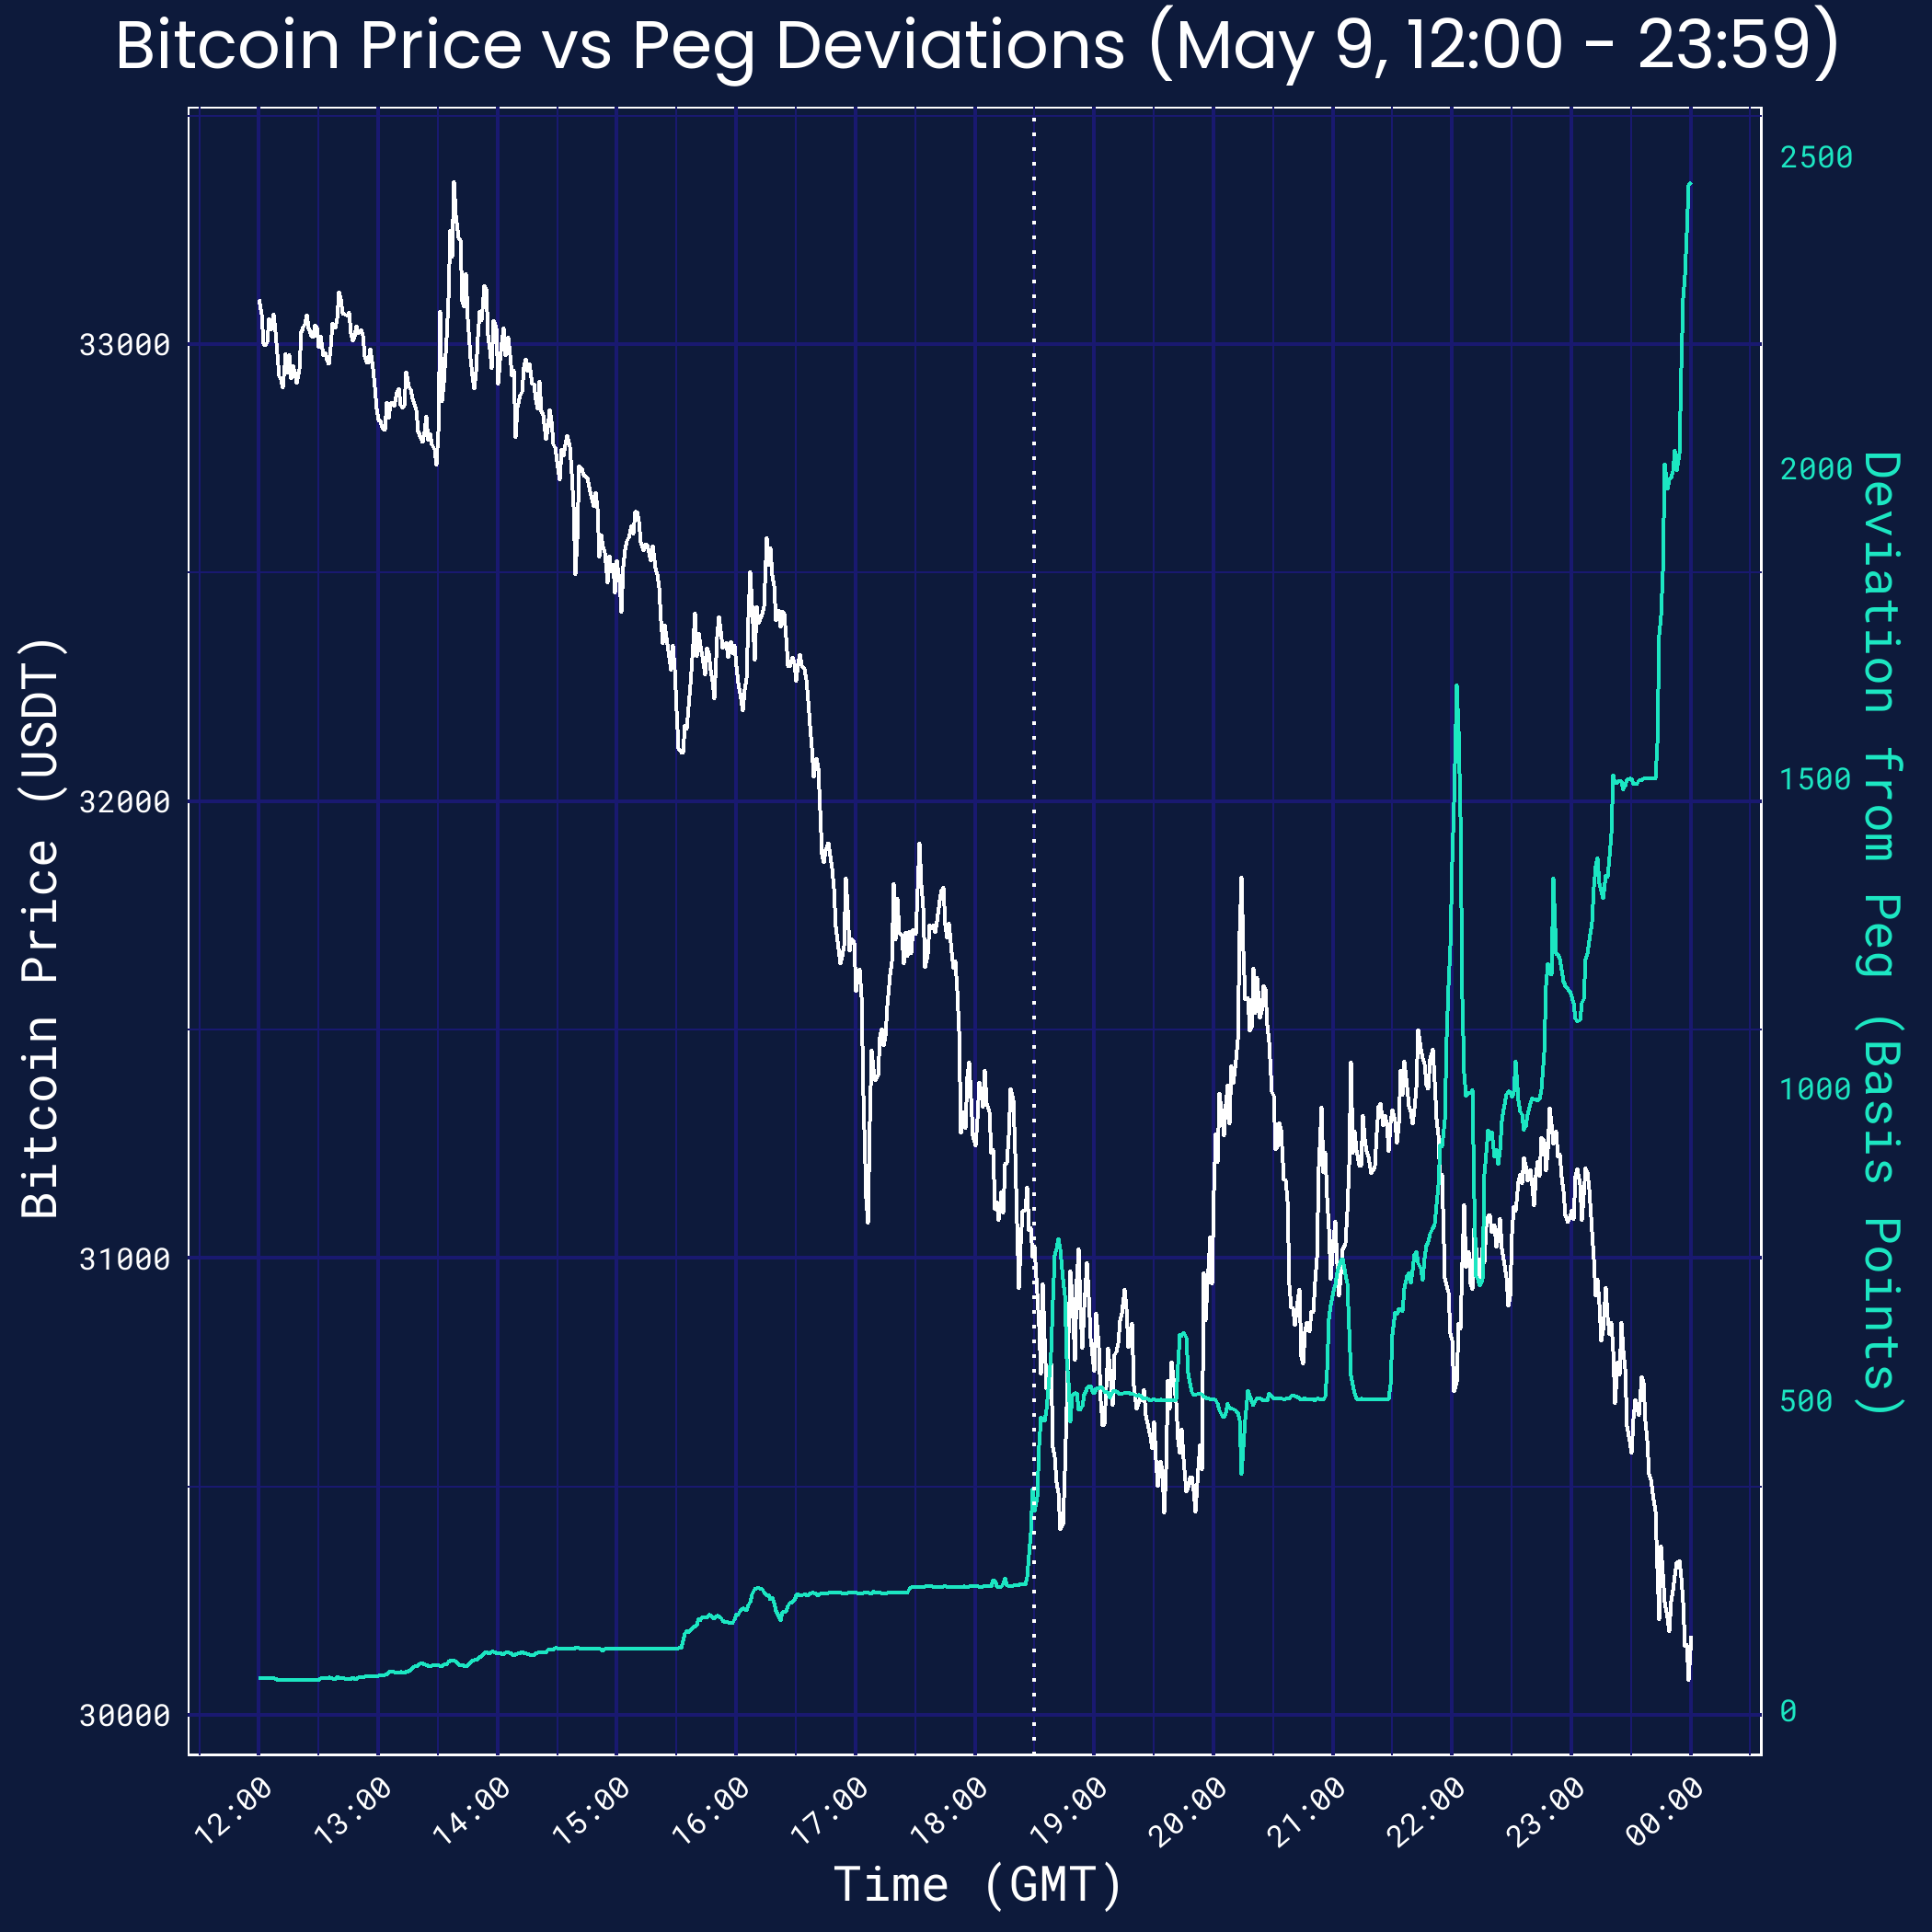
But on a closer examination of the graph, the evening (GMT) of May 9 looks particularly critical, as BTC fell sharply just as UST came off the peg meaningfully. We examine this potential relationship in the graph below.[27][28] We find that indeed the significant drawdown in BTC’s price immediately (just before 18:30) preceded the first large de-peg instance for UST (just after 18:30).
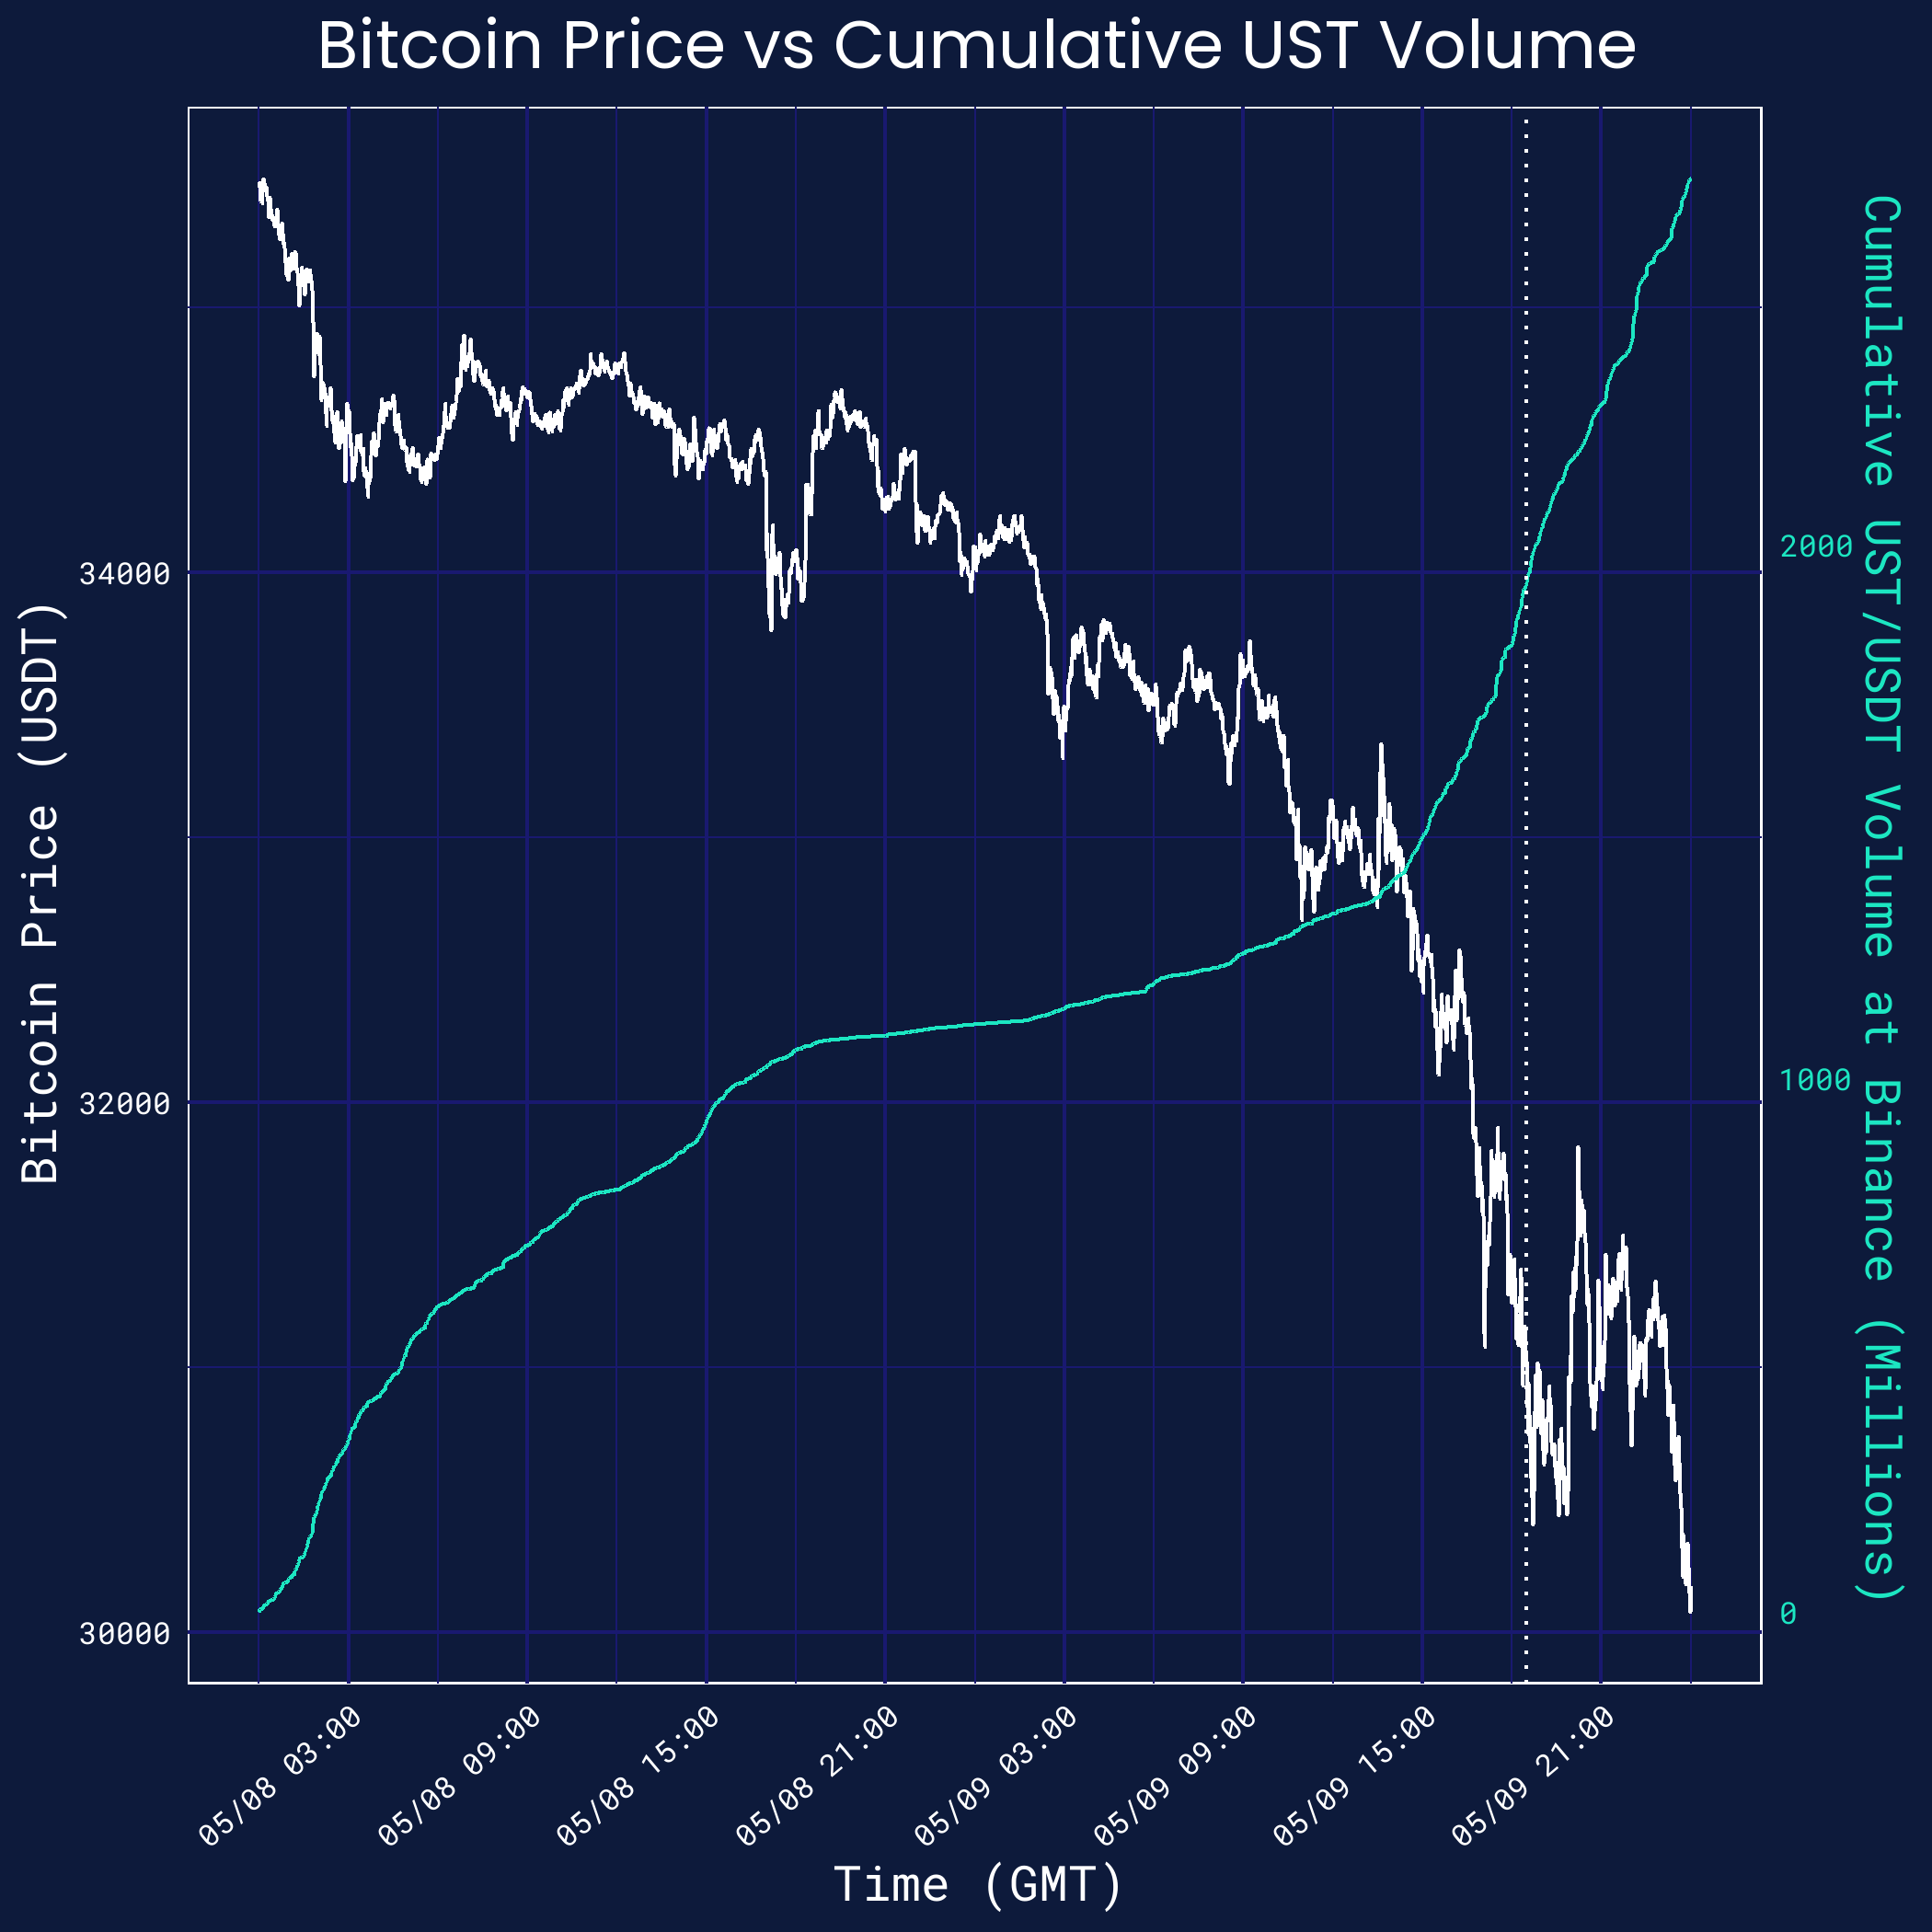
To further the point, we compare the Bitcoin price over May 8 and May 9 to the cumulative volume for the UST/USDT trading pair on Binance in the graph below.[29][30] (This was the dominant venue on centralized exchanges for UST over these days.) There seems to be a pattern in the data: when prices were more steady, volumes moved slowly, and when prices fell, volumes moved up quickly. Indeed, as Bitcoin’s plunge on May 9 accelerated, UST volumes accelerated too — right up until 18:30 GMT, when UST experienced this first de-peg instance.
Market Sentiment
At face value, this is not perfect evidence of a causal relationship. For instance, one might argue that this risk-off sentiment was due to Terra, rather than the other way around.
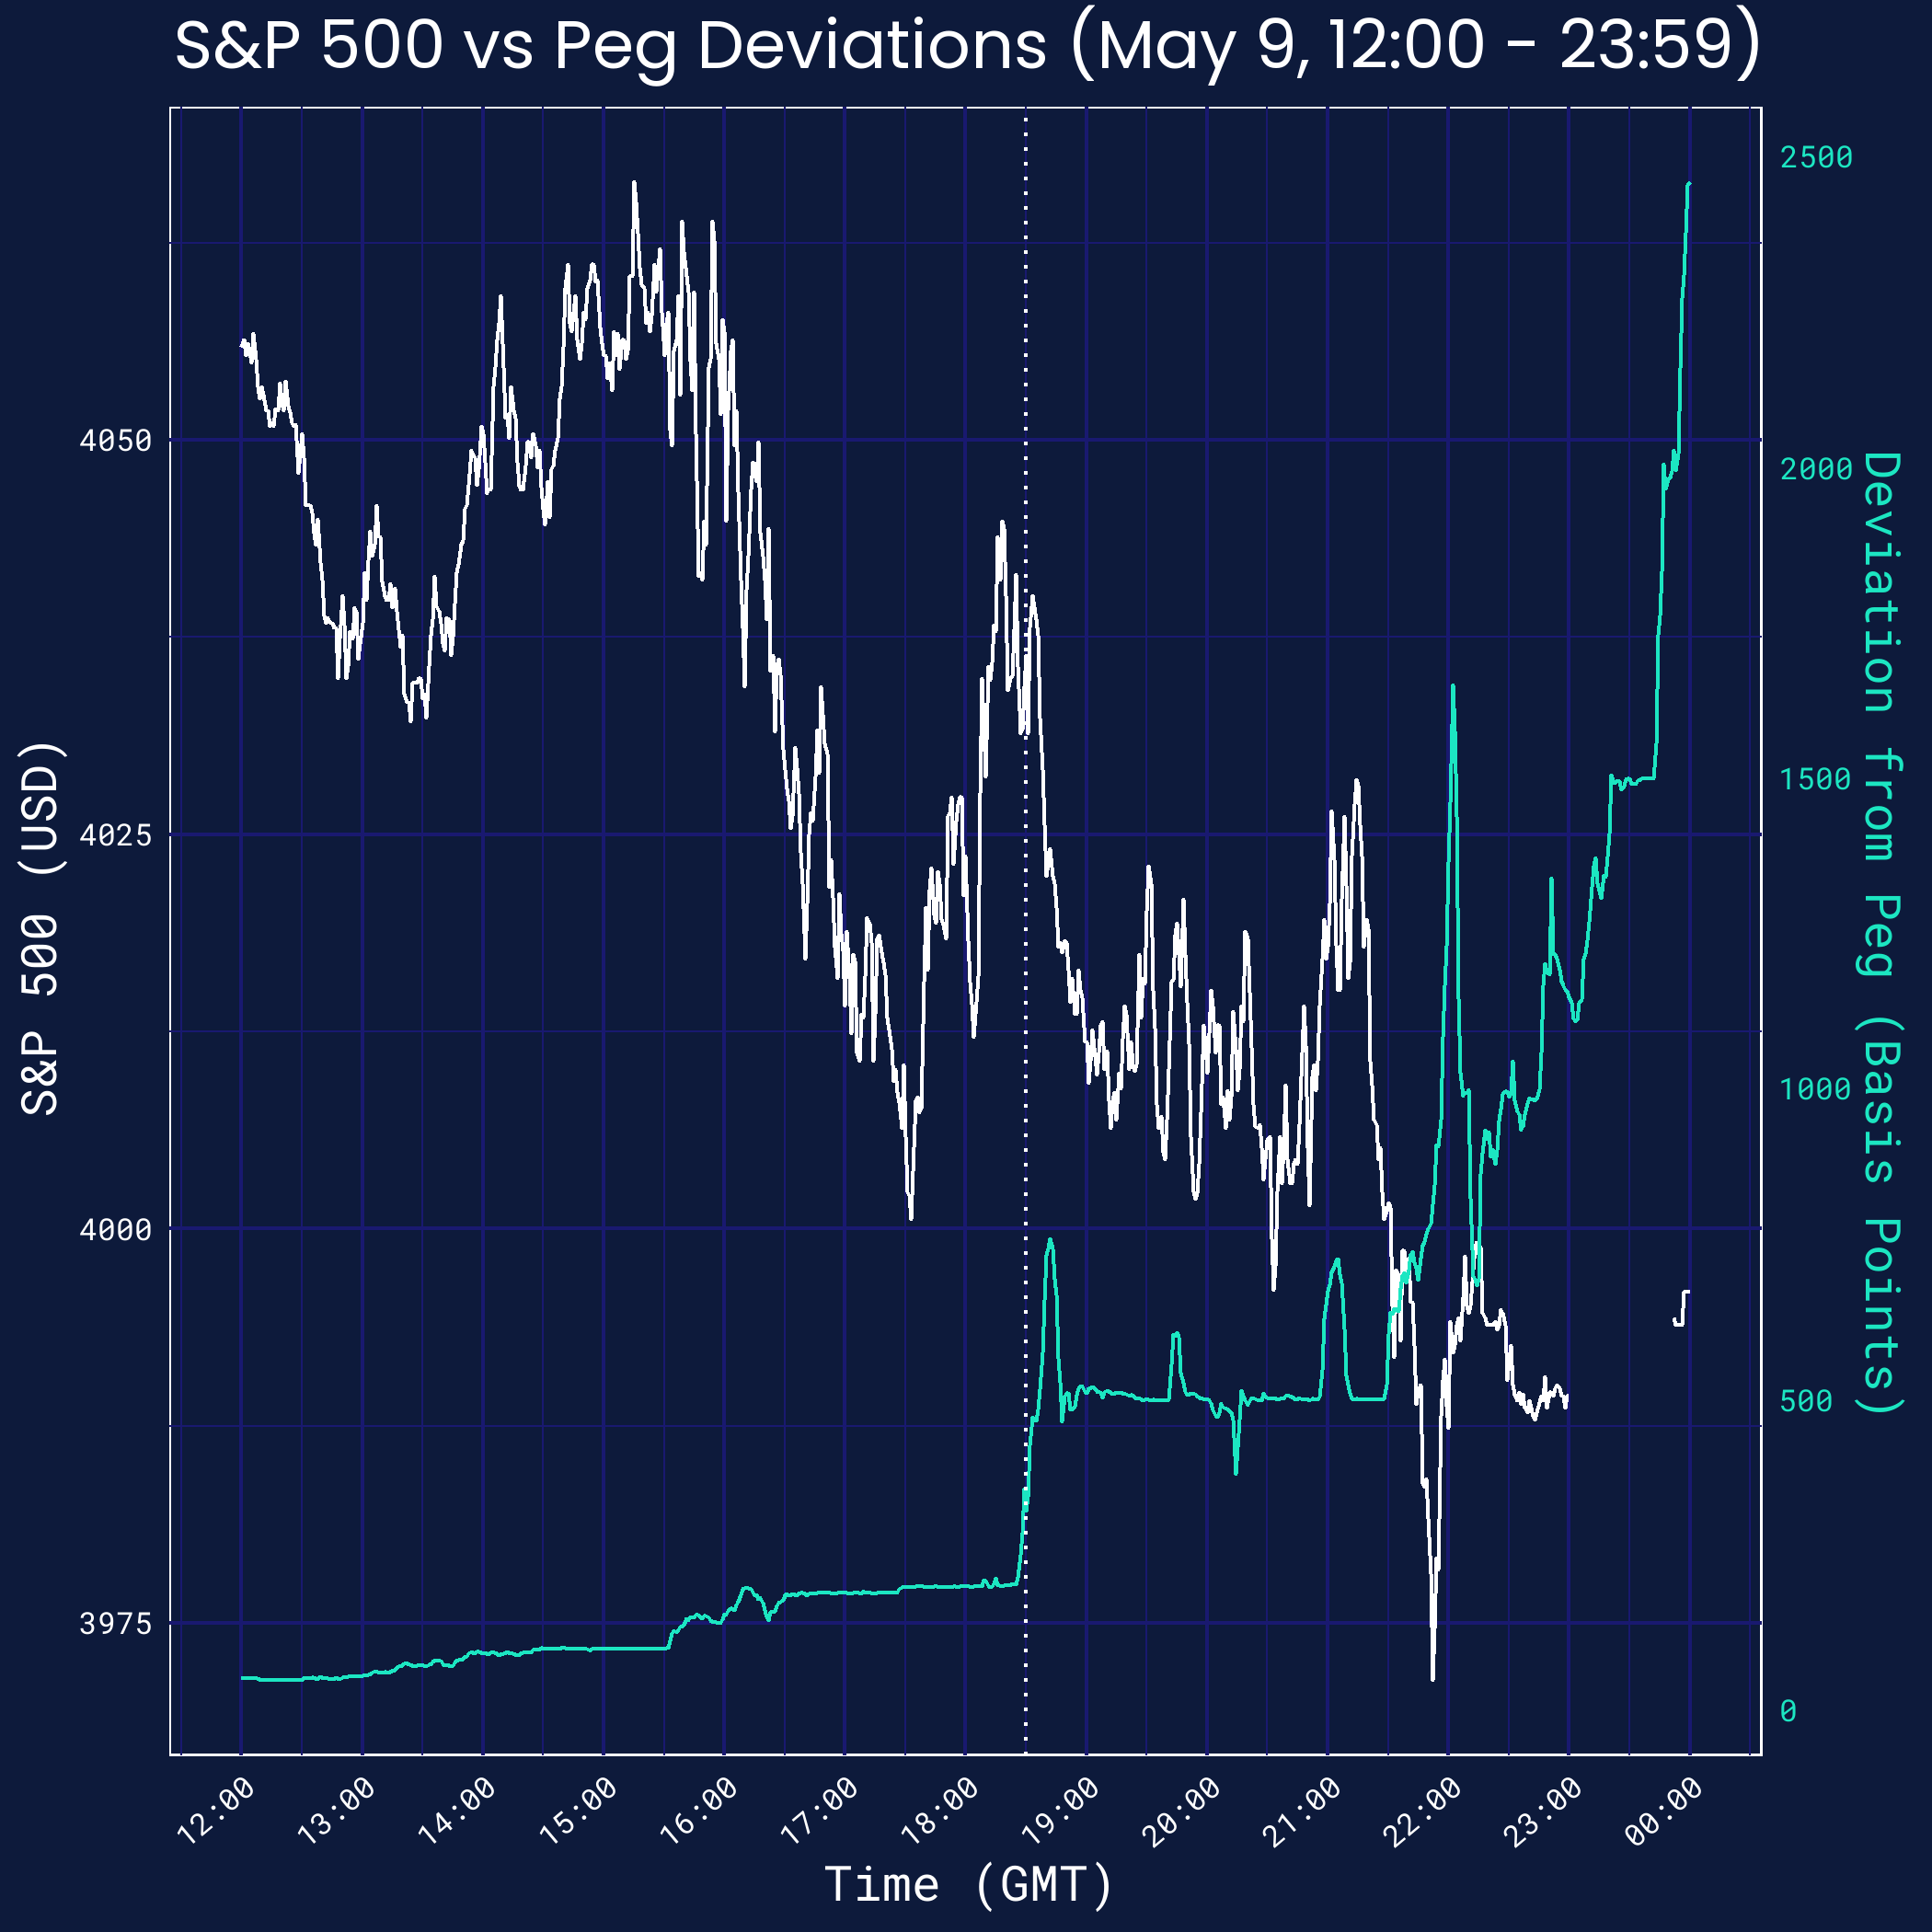
However, non-crypto traditional markets also faced strong downwards pressure over this time interval, and this largely aligned with BTC. The following graph — which measures the price of the S&P 500 (as proxied by its futures contract for mostly continuous coverage) against UST’s deviation from its peg — shows this.[31][32] Thus, we believe the primary direction of this relationship is from bearish market sentiment to UST, and that risk-off sentiment played a key role in further pushing UST away from the $1.00 mark.
Conclusion: LUNA
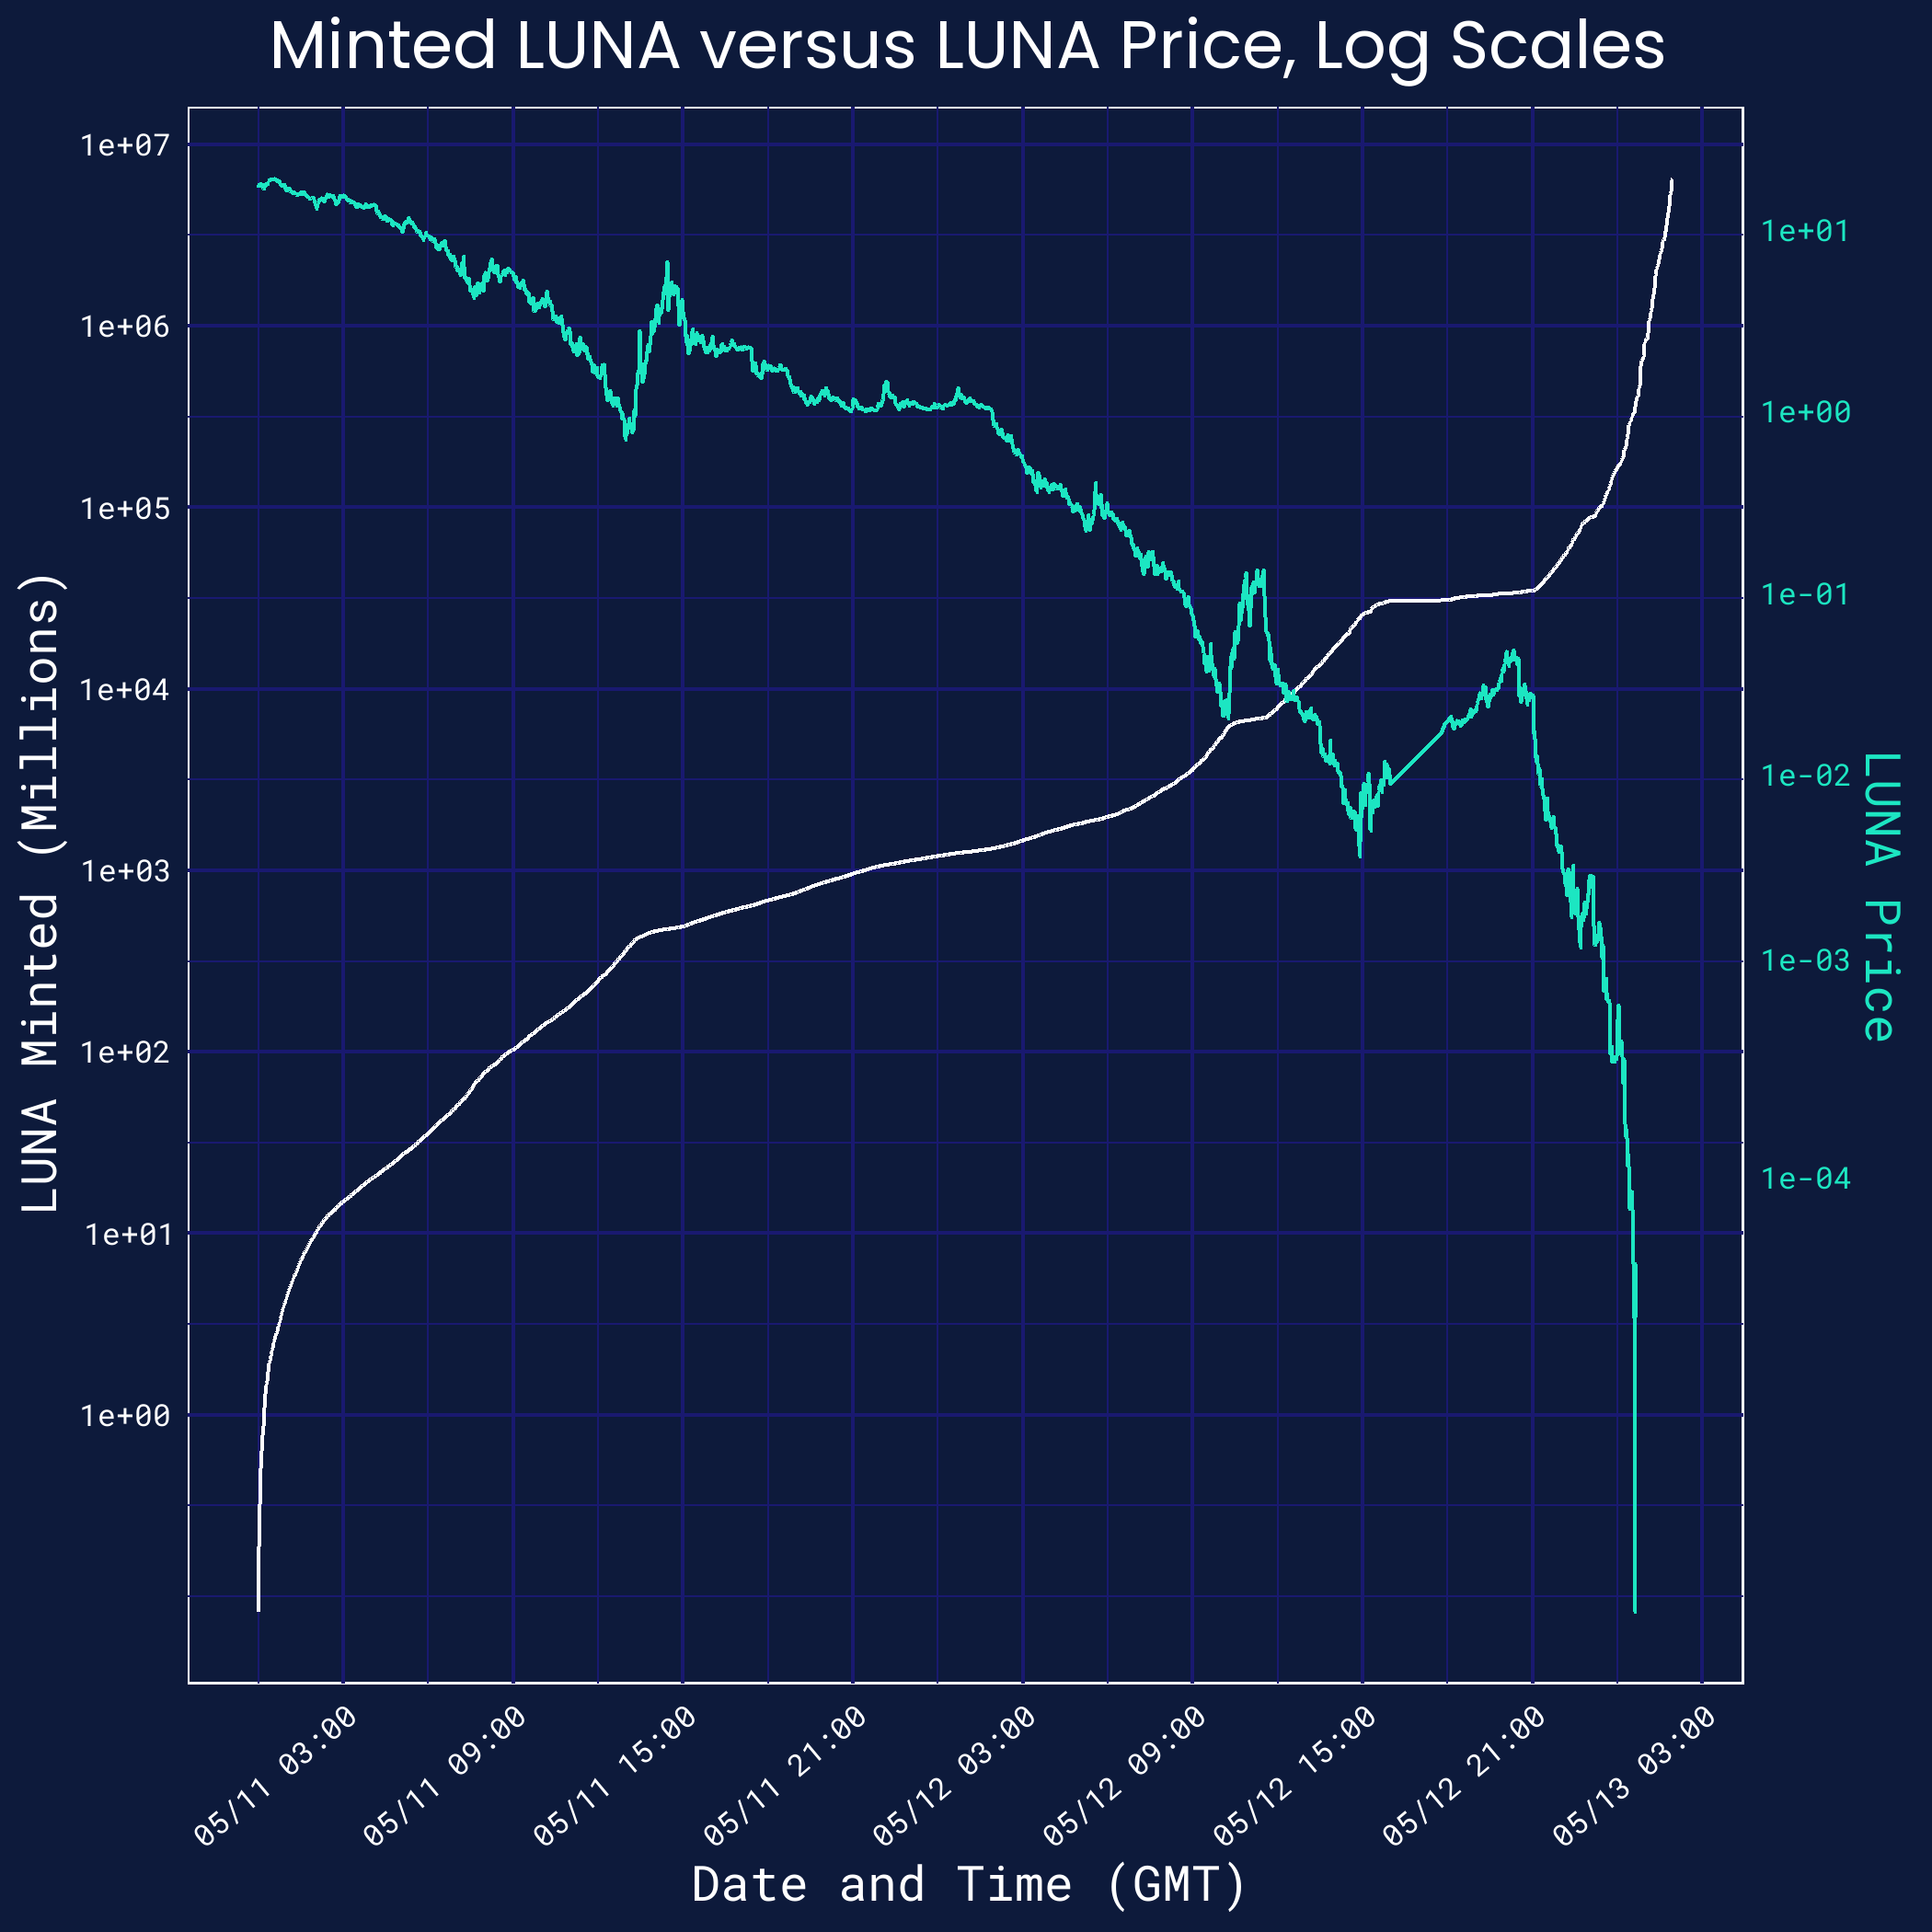
By the end of Monday, May 9, UST had deviated strongly from the peg. In the following days, the price of LUNA — which had been already falling during this episode — crashed, as a primary channel to absorb UST.
In particular, there was a total supply of a few hundred million LUNA before May 7 — and from May 7 through May 9, the Terra on-chain mint-and-burn mechanism printed another few million. But the pace intensified after that. On May 10, the mechanism printed forty million; on May 11, it printed one billion; on May 12, it printed two hundred billion; and it printed six trillion over the first few hours on May 13 (before the chain was halted for the second time and our data sources stopped tracking).[33][34]
We hope the analysis is useful for developers, traders, and community members alike.
Please let us know what we got wrong, as we'd like to understand this subject matter thoroughly and correctly. Thanks to the research team at Jump Crypto for feedback. This note does not constitute financial advice.
Appendix
A.1 Large Trades and Curve Liquidity on May 7, 18:00 - 23:00
We examine the Curve pool in more depth to find any large trades or withdrawals (greater than $10 million) between 18:00 and 23:00 GMT on May 7. There are eleven, all listed below in chronological order with linked hashes.
Ethereum BlockTime (GMT)Transaction HashActorTrade Size (UST)Method1473145918:44HashWallet C$15MMWithdraw1473148118:48HashWallet C$16MMSwap1473176819:55HashWallet D$30MMWithdraw1473223521:44HashTFL$150MMWithdraw1473228721:57HashWallet A$85MMSwap1473244722:32HashWallet B$25MMSwap1473245922:35HashWallet B$25MMSwap1473247622:38HashWallet B$25MMSwap1473254722:52HashTFL$100MMWithdraw1473258122:59HashWallet B$25MMSwap1473258823:00HashWallet E$21MMSwap
In the main body, we investigate the trades made between 21:44 and 22:59 in more depth. We do not believe the other trades were as critical to the first de-peg instance, due to smaller sizing or later timing. As some additional context on those trades:
- The first two transactions, by "Wallet C," were part of a broader strategy to accumulate DAI and repay a Maker Vault, to unlock CXV and CRV tokens.
- The third transaction, by "Wallet D," represented a withdrawal of liquidity that was funded by USDC positions in late April.
- The final transaction, by "Wallet E," took place over an hour after the peg was off balance.
An excellent research note recently published by Nansen.ai should be consulted for more depth on the exact transactions in the Curve pool after 23:00 GMT.
A.2 Outflows across Depositors
There are potential missing data concerns for blocks on the Terra network on May 9, and that might make the snapshot of Anchor depositors as of the end of day on May 9 less reliable. As such, we repeat the exercise, but we use a snapshot as of May 8.[35] This shows the same trend in stark terms: most depositors had not drawn down their Anchor positions, but a small cohort (more likely to be large depositors) did so.
- This pricing and volume data for UST are sourced from Binance using the UST/USDT trading pair. The pricing data are originally reported in milliseconds. However, the exhibits display the data in minute intervals. The UST/USDT trading pair on Binance was used to represent the UST price, as this specific pair accounted for a majority trading volume across centralized exchanges on these three days. ↩︎
- See footnote 1. ↩︎
- Data regarding withdrawals, deposits, position transfers, and liquidations at Anchor are sourced from the on-chain Terra transaction data. These data are queried using Flipside Crypto. Flipside Crypto curates Anchor-specific databases directly, although they also did miss blocks on May 9 — and so we rely on estimation techniques to account for the missing data. For graphs that perform analyses on depositors, we also exclude bridges (e.g. the ETH Shuttle), protocols, and wallets known to be owned by Terraform Labs. ↩︎
- At a high level, Curve is a decentralized automatic market maker (AMM) that allows users to swap between tokens, depositing one (e.g. UST) and withdrawing another (e.g. USDC). The exchange rate between the two is governed by the relative supplies, where the token that is more plentiful in the pool depreciates relative to the token that is more scarce. Users provide liquidity to the pool by depositing tokens and receiving claims on the pool’s future assets and revenues. For a more detailed description, please see Curve’s documentation (linked here). ↩︎
- See footnote 1. ↩︎
- Data regarding the Curve pool are sourced from the on-chain Ethereum transaction data. These data are queried using Flipside Crypto, and the queries in turn focus on the contract associated with address 0xCEAF7747579696A2F0bb206a14210e3c9e6fB269. The on-chain data show transactions with the pool: swap transactions provide an implicit swap price, and all transactions update quantities. ↩︎
- See footnote 6. ↩︎
- See footnote 6. ↩︎
- See footnote 1. ↩︎
- See footnote 6. ↩︎
- Data regarding UST transfers from the Terra network to Binance are sourced from the on-chain Terra transaction data. These data are queried using Flipside Crypto, and the queries in turn focus on transfers to Binance’s Terra deposit address terra1ncjg4a59x2pgvqy9qjyqprlj8lrwshm0wleht5 (as well as Binance’s other known Terra withdrawal addresses for robustness). ↩︎
- See footnote 1. ↩︎
- See footnote 1. ↩︎
- See footnote 6. ↩︎
- See footnote 3. ↩︎
- See footnote 3. ↩︎
- See footnote 3. ↩︎
- See footnote 1. ↩︎
- See footnote 3. ↩︎
- See footnote 3. ↩︎
- See footnote 3. ↩︎
- See footnote 3. ↩︎
- See footnote 3. ↩︎
- See footnote 3. ↩︎
- See footnote 1. ↩︎
- The pricing data are sourced from Binance for the BTC/USDT trading pair. The pricing data are originally reported in milliseconds. However, the exhibits display the data in minute intervals. The BTC/USDT trading pair on Binance was used to represent the BTC price, as this specific pair accounted for a significant share of centralized exchange trading volume. ↩︎
- See footnote 1. ↩︎
- See footnote 26. ↩︎
- See footnote 1. ↩︎
- See footnote 26. ↩︎
- See footnote 1. ↩︎
- The pricing data for the E-MINI S&P 500 Futures are available at Trading View, linked here. These futures do not trade from 16:00 CT until just before 17:00 CT on each day, as noted here. ↩︎
- The pricing data are sourced from Binance for the LUNA/USDT trading pair. The pricing data are originally reported in milliseconds. However, the exhibit displays the data in minute intervals. The LUNA/USDT trading pair on Binance was used to represent the LUNA price, as this specific pair accounted for a significant share of centralized exchange trading volume across these three days. ↩︎
- Data regarding the quantity of LUNA minted on the Terra network are sourced from the on-chain Terra transaction data. These data are queried using Flipside Crypto, and the queries in turn focus on the on-chain events tagged "swap" from UST to LUNA. ↩︎
- See footnote 3. ↩︎